
You’ve been handed an unlabelled bottle. Is it lead nitrate or barium chloride? Is the liquid inside ethanol or propanone? Module 8 is where HSC Chemistry turns into detective work: every test, every instrument and every spectrum is a clue, and the answer comes from putting the clues together. This page is part of our HSC Chemistry notes, which summarise all four Year 12 modules in one place.
These HSC Chemistry Module 8 notes follow the three inquiry questions of Module 8: Applying Chemical Ideas in the NSW Chemistry Stage 6 Syllabus. They’re written from the lessons our tutors teach in class, and each topic opens with the exact syllabus dot point it covers. Module 8 pulls together everything before it: precipitation from our HSC Chemistry Module 5 notes, titration from Module 6 and functional groups (the reactive group of atoms that gives a family its reactions) from Module 7.
These are theory and revision notes. Reading notes doesn’t replace the practical investigations the syllabus asks you to do in class.
Key Takeaways
- Ions are identified by a sequence of tests: precipitation with anions, flame colours, and coloured complexes. Order matters, because one test can hide another.
- Gravimetric analysis finds how much of an ion is present by weighing a pure, dry precipitate; precipitation titrations do it by volume.
- Colourimetry, UV-visible spectrophotometry and atomic absorption spectroscopy (AAS) measure concentration from absorbance using a calibration curve.
- Functional groups are identified by simple tests: bromine water for C=C, oxidation for –OH, sodium carbonate for carboxylic acids.
- Infrared spectroscopy shows which bonds are present, mass spectrometry gives the molar mass and fragments, and ¹³C and ¹H NMR (nuclear magnetic resonance) show the carbon and hydrogen environments.
- Designing a synthesis means balancing reagents, conditions, yield, purity, uses and environmental, social and economic costs.
- Working Scientifically skills (graphs, error, evaluating a method, command words) are marked in many Module 8 questions: see the skills section.
For how to study all this effectively, see how to actually understand HSC Chemistry.
What Does HSC Chemistry Module 8 Cover?
Module 8 is the last of four Year 12 modules in the NESA Chemistry Stage 6 Syllabus (2017). It’s organised around three inquiry questions, and these notes follow the same order:
| Syllabus section | Inquiry question |
|---|---|
| Analysis of Inorganic Substances | How are the ions present in the environment identified and measured? |
| Analysis of Organic Substances | How is information about the reactivity and structure of organic compounds obtained? |
| Chemical Synthesis and Design | What are the implications for society of chemical synthesis and design? |
How Are the Ions Present in the Environment Identified and Measured?
Why do we monitor the environment?
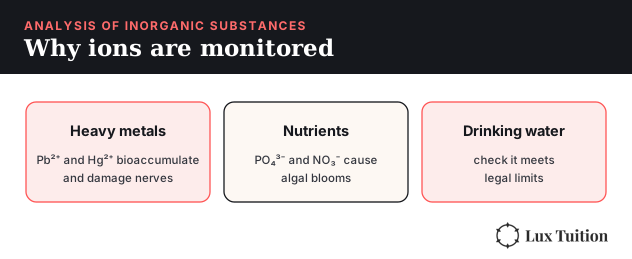
Ions from mining, farming, industry and sewage end up in waterways and soil. Some are toxic even in tiny amounts: lead and mercury are heavy metals that build up in living things (bioaccumulation) and damage the nervous system. Others cause harm in larger amounts, like phosphate and nitrate from fertiliser, which cause algal blooms (eutrophication) that starve rivers of oxygen. Monitoring lets us check that drinking water is safe, that industries meet legal limits, and that problems are caught before they spread.
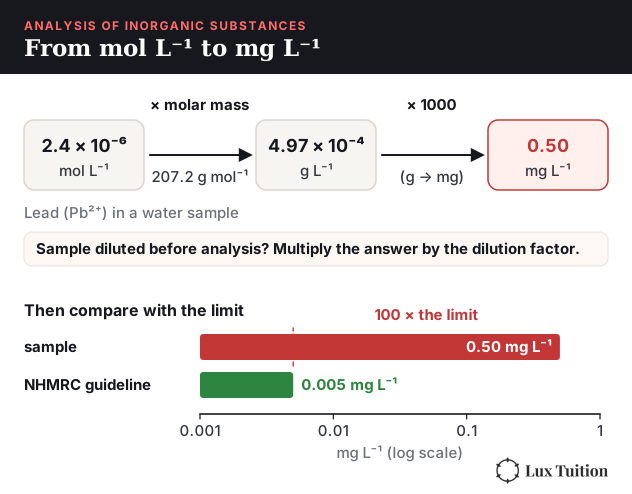
Limits for trace ions are usually given in mg L−1, but most calculations give mol L−1. To convert, multiply by the molar mass (giving g L−1) and then by 1000. For example, water with 2.4 × 10⁻⁶ mol L−1 of Pb2+ contains 2.4 × 10−6 × 207.2 × 1000 = 0.50 mg L−1 of lead, 100 times the Australian drinking water guideline of 0.005 mg L−1 (NHMRC, endorsed 2025). In an exam, use the limit you are given. If the sample was diluted before it was analysed, multiply the result by the dilution factor.
How to test for cations
Qualitative analysis answers the question “which ion is there?” Three kinds of reaction are used:
- Precipitation: adding an anion that forms an insoluble salt with the cation.
- Flame tests: heating the metal ion excites its electrons, which emit a characteristic colour as they fall back.
- Complexation: a molecule or ion bonds around a metal ion to form a coloured complex ion.
A common sequence for an unknown containing one cation:
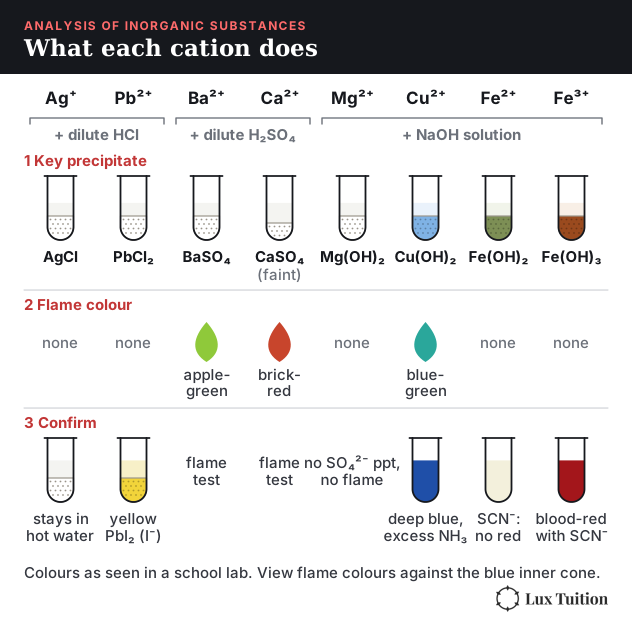
- Add dilute HCl. A white precipitate means Ag+ (AgCl) or Pb2+ (PbCl2). Lead chloride dissolves again in hot water; silver chloride doesn’t.
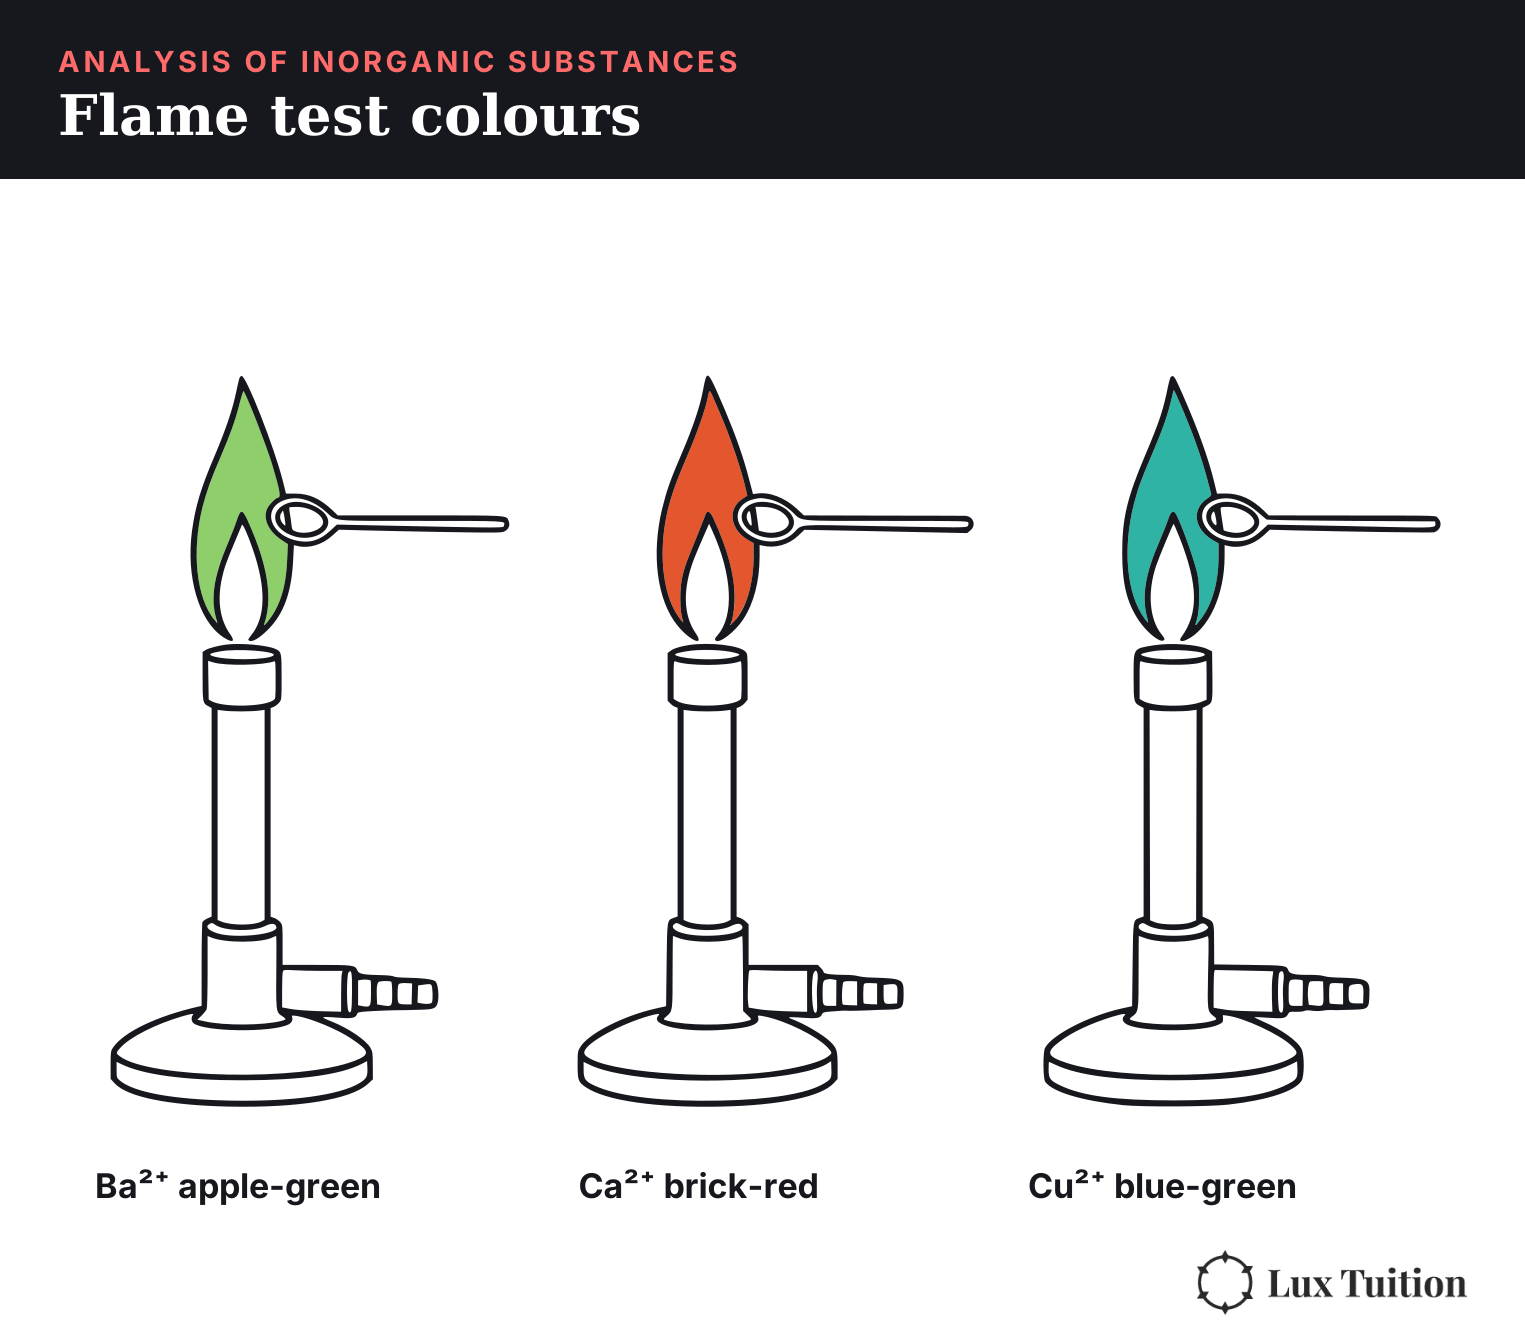
- Add dilute H2SO4. A white precipitate means Ba2+ (BaSO4) or Ca2+ (CaSO4, which is only slightly soluble, so it may form only faintly). A flame test separates them: barium is apple-green, calcium is brick-red.
- Add NaOH solution. The hydroxide colour identifies what’s left: Mg2+ white, Cu2+ blue, Fe2+ green, Fe3+ red-brown.
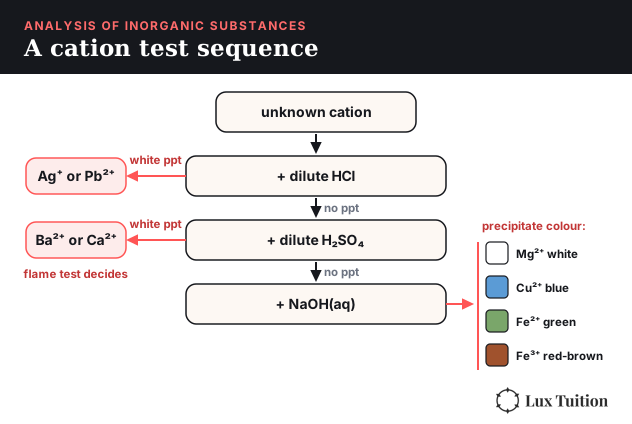
Complexation confirms the transition metals. Cu2+ with excess ammonia forms deep blue [Cu(NH3)4]2+. Fe3+ with thiocyanate forms blood-red FeSCN2+ (the same complex from Module 5), while Fe2+ gives no red colour. Copper also gives a blue-green flame.
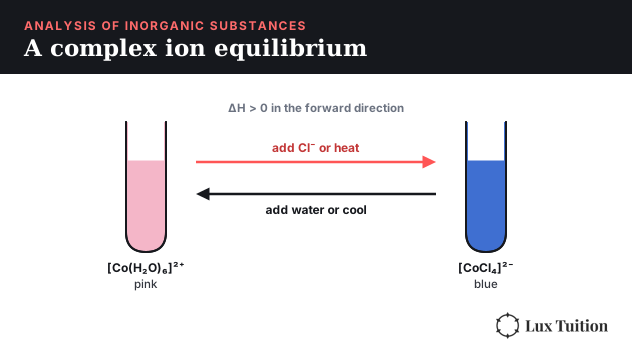
A complex ion is a metal ion with molecules or ions bonded around it, and in exams complex ions usually come with an equilibrium. The classic one is cobalt(II) chloride:
[Co(H2O)6]2+(aq, pink) + 4Cl−(aq) ⇌ [CoCl4]2−(aq, blue) + 6H2O(l), ΔH > 0
Adding chloride (for example concentrated HCl) or heating shifts it right and the solution turns blue. Adding water or cooling shifts it left and it turns pink. Because complex ions are coloured, colourimetry can measure their concentration, which is how an equilibrium constant for complex formation can be found from a calibration curve.
How to test for anions
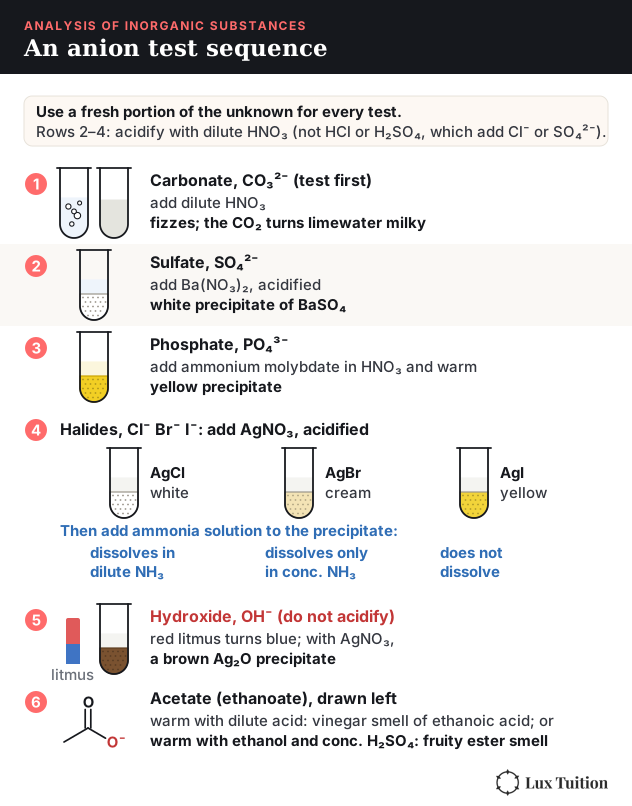
- Carbonate (CO32−): add dilute nitric acid. Bubbles of CO2 that turn limewater milky confirm carbonate. Test this first, because carbonate also precipitates with Ag+ and Ba2+.
- Sulfate (SO42−): add acidified barium nitrate. A white BaSO4 precipitate forms.
- Phosphate (PO43−): add ammonium molybdate in nitric acid and warm. A yellow precipitate forms. (Phosphate also precipitates with Ba2+, but it dissolves in acid, unlike BaSO4.)
- Halides (Cl−, Br−, I−): add acidified silver nitrate. Cl− gives white AgCl, Br− cream AgBr, I− yellow AgI. Their solubility in ammonia confirms which: AgCl dissolves in dilute NH3, AgBr only in concentrated NH3, and AgI not at all.
- Hydroxide (OH−): once carbonate has been ruled out (it’s basic too), turns red litmus blue, and gives a brown Ag2O precipitate with silver nitrate.
- Acetate (the ethanoate ion, C2H3O2−, drawn in Module 8 Figure 8): warm with dilute acid and the vinegar smell of ethanoic acid appears. Or warm with ethanol and concentrated sulfuric acid to make the fruity smell of an ester.
The acid is added first in most anion tests so that carbonate or hydroxide can’t form a misleading precipitate. Use a fresh sample for each anion test, and never acidify the portion you are testing for hydroxide, because the acid would use up the OH− and hide it.
What is gravimetric analysis?
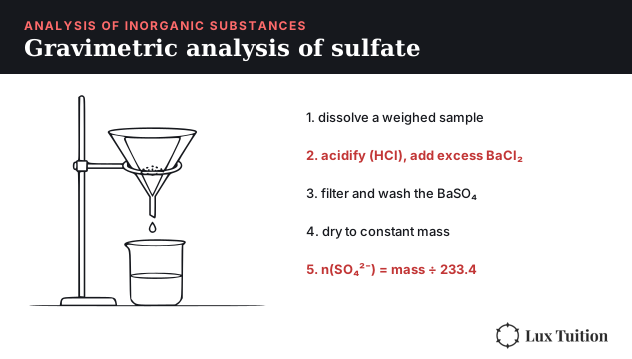
Gravimetric analysis finds the amount of an ion by converting it into a pure precipitate of known formula, then weighing it. For sulfate in fertiliser:
- Weigh the sample and dissolve it in water.
- Acidify with dilute HCl (so carbonate or phosphate can’t precipitate too), then add excess barium chloride solution so all the sulfate precipitates as BaSO4.
- Filter, and wash the precipitate with distilled water to remove soluble impurities.
- Dry it in an oven and weigh it. Repeat drying and weighing until the mass stays constant.
- Calculate: moles of BaSO4 = mass ÷ 233.4 = moles of SO42−, then find the mass and percentage of sulfate.
Worked example. A 2.00 g fertiliser sample gives 1.62 g of dry BaSO4. n(BaSO4) = 1.62 ÷ 233.4 = 6.94 × 10⁻³ mol. Mass of SO42− = 6.94 × 10−3 × 96.07 = 0.667 g, so the sample is 33.3% sulfate by mass.
Sources of error: an incompletely dried precipitate (too heavy, result too high), precipitate lost through the filter paper (too light, too low), or other ions co-precipitating (too high).
What is a precipitation titration?
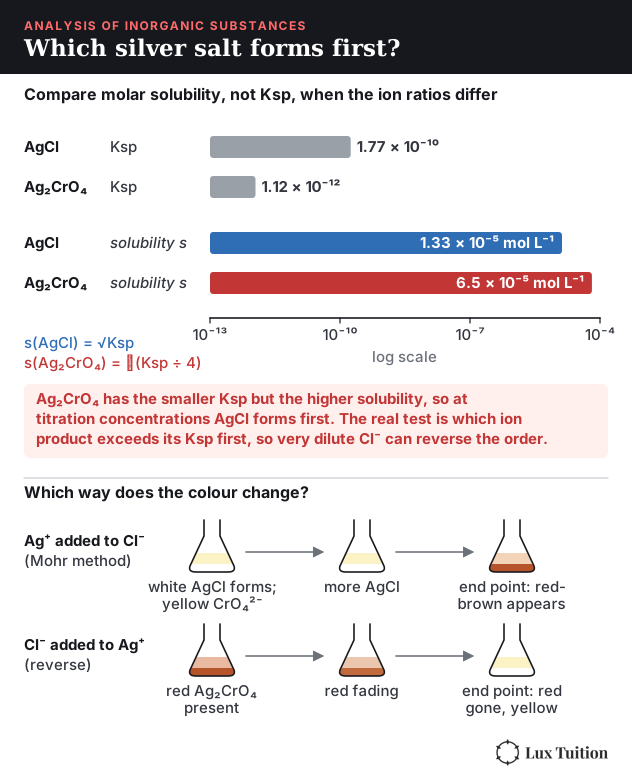
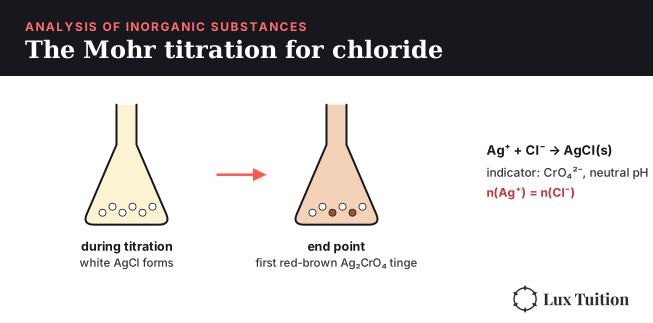
A precipitation titration finds a concentration by titrating until an indicator shows all the analyte ion has precipitated (the analyte is the ion you are measuring). The standard example measures chloride by titrating with standard silver nitrate: Ag+ + Cl− → AgCl(s). In the Mohr method, a little potassium chromate is added as the indicator. AgCl has a lower molar solubility than silver chromate, so AgCl forms first. The solution must be close to neutral pH for the indicator to work. Once all the chloride is used up, the next drop of Ag+ forms red-brown Ag2CrO4, marking the end point. The moles of Ag+ used equal the moles of Cl− in the sample. In this case, adding silver nitrate to chloride, the end point is when the indicator’s precipitate first appears. As a shortcut for most indicator questions, the precipitate with the lower molar solubility tends to form first, but the real decider is the actual ion concentrations and whether the ion product exceeds Ksp. If the titration is run the other way, with chloride added to silver, the red Ag2CrO4 is there from the start and disappears at the end point (red to yellow), because the last silver ions are used up by chloride. Compare molar solubilities, not Ksp values, when the formulas have different ion ratios: Ag2CrO4 has the smaller Ksp but the higher molar solubility.
How to calculate a back titration for chloride
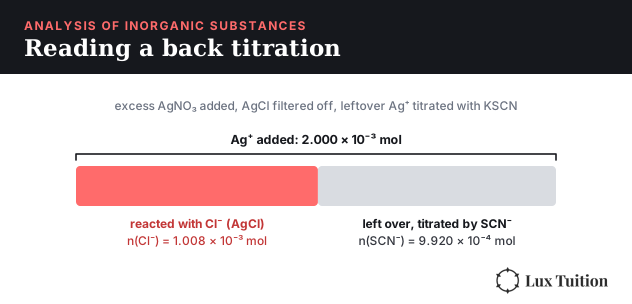
In a back titration, a known excess of silver nitrate is added to the chloride sample. All the chloride precipitates as AgCl, the AgCl is filtered off, and the Ag+ left over is titrated with standard potassium thiocyanate (KSCN), using Fe3+ as the indicator. Ag+ + SCN− → AgSCN(s), and the first excess SCN− forms red FeSCN2+. The chloride is whatever silver wasn’t left over:
n(Cl−) = n(Ag+ added) − n(SCN− used)
Worked example. 20.00 mL of 0.1000 mol L−1 AgNO3 is added to a 25.00 mL water sample. After filtering, the leftover Ag+ needs 12.40 mL of 0.08000 mol L−1 KSCN.
- n(Ag+ added) = 0.1000 × 0.02000 = 2.000 × 10⁻³ mol
- n(Ag+ left over) = n(SCN−) = 0.08000 × 0.01240 = 9.920 × 10⁻⁴ mol
- n(Cl−) = 2.000 × 10⁻³ − 9.920 × 10−4 = 1.008 × 10⁻³ mol
- c(Cl−) = 1.008 × 10⁻³ ÷ 0.02500 = 0.04032 mol L−1
- In mg L−1: 0.04032 × 35.45 × 1000 = 1.429 × 10³ mg L−1 of chloride
Two slips cost marks here: forgetting to subtract the leftover silver, and multiplying by the molar mass of AgCl (143.3) instead of Cl (35.45) when the question asks for chloride.
How does colourimetry work?
A coloured solution absorbs some wavelengths of light and transmits the rest. A deep blue copper solution absorbs orange-red light, the complementary colour. The more concentrated the solution, the more light it absorbs. The absorbance (A) is proportional to concentration (the Beer–Lambert law, A = εcl, where ε is a constant for that substance at that wavelength, c is the concentration and l is the path length, the width of the cuvette), which makes a straight-line relationship.
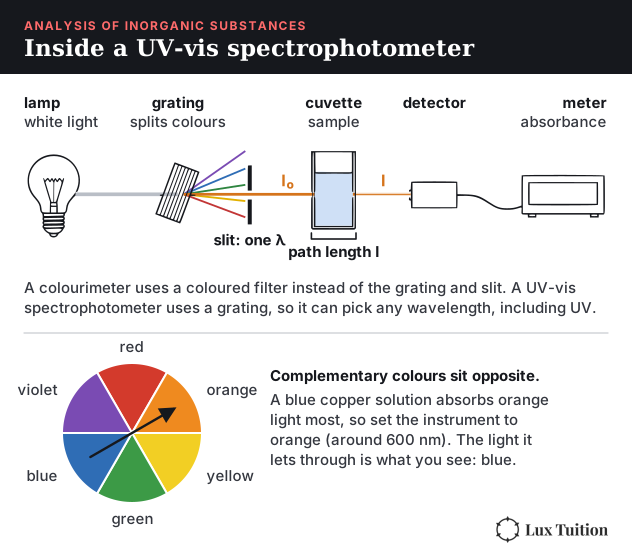
A colourimeter shines light of one colour, chosen as the colour the sample absorbs most, through the sample and measures how much gets through. To find an unknown concentration:
- Prepare a series of standard solutions of known concentration.
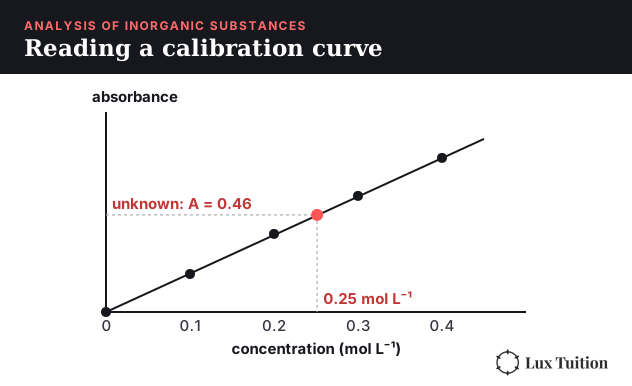
- Measure the absorbance of each, and plot a calibration curve of absorbance against concentration.
- Measure the unknown’s absorbance, then read its concentration off the curve.
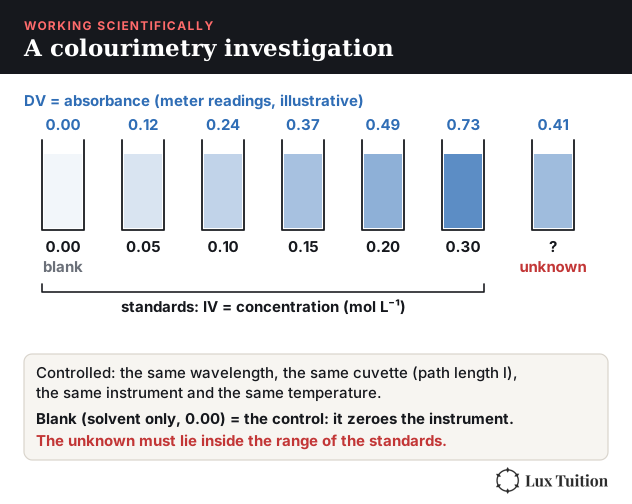
The unknown must fall inside the range of the standards. If it’s too concentrated, dilute it and multiply back.
When you draw the calibration curve, follow the graphing conventions: label both axes with the quantity and its unit (absorbance has no unit), use an even scale, plot each point, and draw a straight line of best fit rather than joining the dots. If two substances share one graph, use a different symbol for each and add a key. The full method is in the Working Scientifically skills section at the end.
UV-visible spectrophotometry
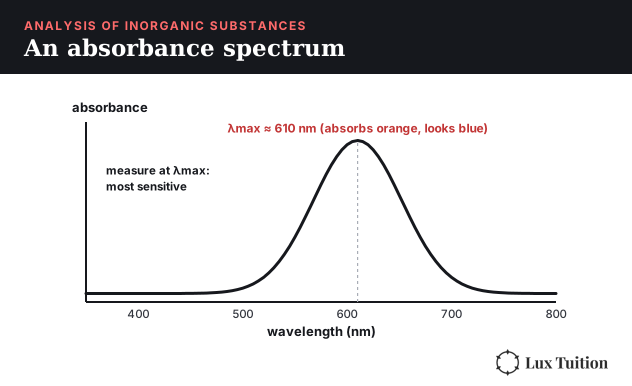
A UV-visible spectrophotometer does the same job more precisely. It uses a prism or diffraction grating to select one exact wavelength, usually the wavelength of maximum absorbance (λmax), where the measurement is most sensitive. It also reaches ultraviolet wavelengths, so it can measure colourless compounds that absorb UV light. A calibration curve is used in the same way.
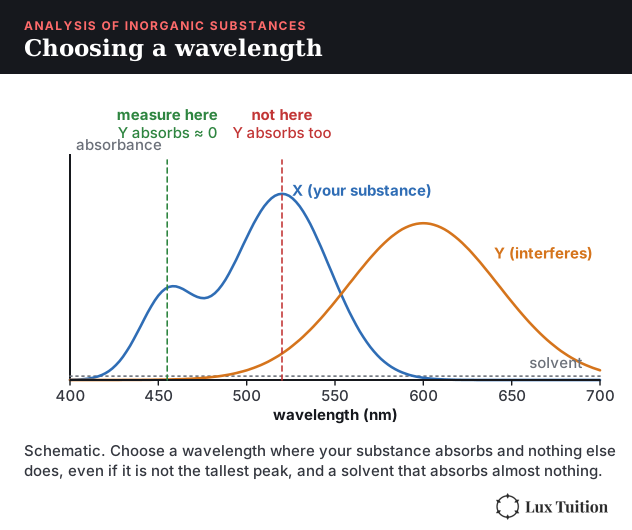
Two choices make the measurement fair. Choose a solvent that absorbs almost nothing at the wavelength you are measuring, so it doesn’t add to the reading. In a mixture, pick a wavelength where your substance absorbs and the others absorb almost nothing, even if that is not the tallest peak of your substance.
How does atomic absorption spectroscopy (AAS) work?
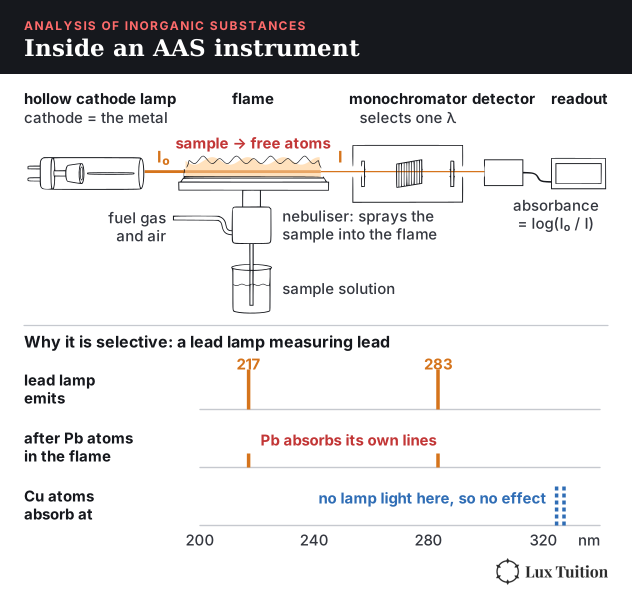
AAS, developed in Australia by Alan Walsh at the CSIRO in the 1950s, measures the concentration of a specific metal, even at parts-per-million levels (ppm: parts per million, about mg per kg of sample).
- A hollow cathode lamp made of the metal being tested emits exactly the wavelengths that metal’s atoms absorb.
- The sample is sprayed into a flame, which breaks it into free, ground-state atoms.
- Those atoms absorb the lamp’s light. Only the target metal absorbs these exact wavelengths, so other metals interfere very little.
- A monochromator selects one wavelength and a detector measures how much light is left. Absorbance is compared against a calibration curve.
AAS is used to measure heavy metals like lead and mercury in water, soil and blood.
How Is Information About the Reactivity and Structure of Organic Compounds Obtained?
How to test for functional groups
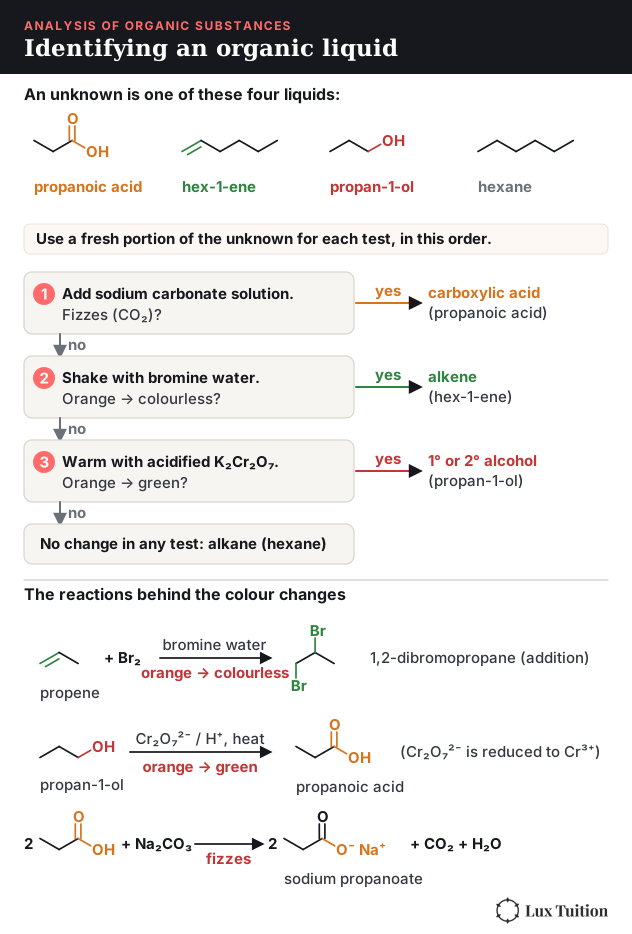
- C=C double bond: shake with bromine water. An alkene decolourises it immediately (orange-brown to colourless) through addition. An alkane doesn’t react with bromine water (without UV light), so the orange colour stays.
- Hydroxyl group (–OH) in an alcohol: warm with acidified potassium dichromate. Primary and secondary alcohols turn it from orange to green; tertiary alcohols don’t. A second option is sodium metal, which fizzes with H2, but it reacts with any –OH, including water and acids. To avoid a false positive, use a dry sample and first rule out a carboxylic acid with sodium carbonate.
- Carboxylic acids (the carboxyl group): add sodium carbonate (or hydrogen carbonate). It fizzes with CO2, which alcohols don’t do. Use a separate portion of the sample for this exclusion test. It also turns blue litmus red.
- Oxidisable groups (alkenes, primary and secondary alcohols): acidified potassium permanganate goes from purple to colourless. It reacts with alkenes and with primary and secondary alcohols, but not with alkanes or typical saturated carboxylic acids such as propanoic acid (methanoic acid is an exception, because permanganate oxidises it). For a mixture, remember that small alcohols and acids mix with water but hydrocarbons do not.
How does mass spectrometry work?
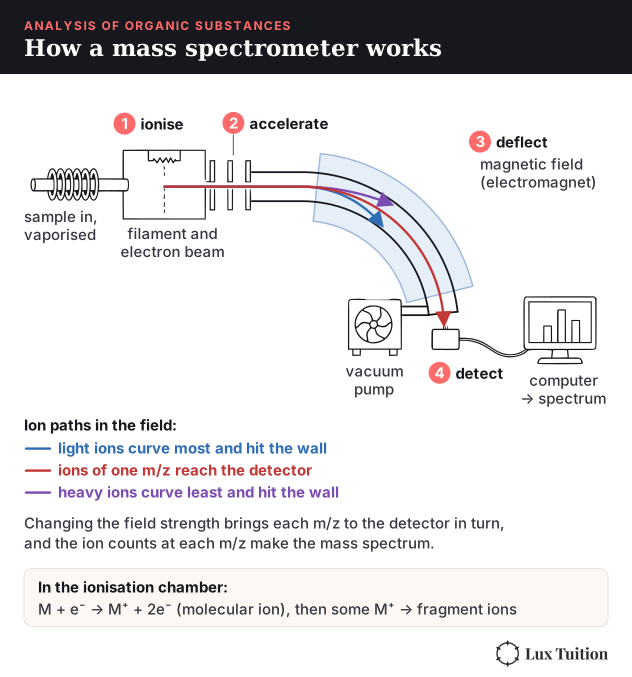
A mass spectrometer measures the mass of molecules and of the pieces they break into.
- The sample is vaporised and bombarded with high-energy electrons, which knock an electron off each molecule to form a positive molecular ion (M+). Many molecular ions break apart into smaller fragments.
- The ions are accelerated and deflected by a magnetic field. Lighter ions are deflected more, so ions are sorted by their mass-to-charge ratio (m/z).
- A detector records how many ions arrive at each m/z value.
Reading a mass spectrum:
- The molecular ion peak (the peak at the highest m/z, ignoring the small M+1 peak and halogen isotope peaks) gives the molar mass of the compound.
- The tallest peak is the base peak, the most abundant ion (usually a stable fragment), set to 100%.
- The gaps between peaks show which pieces broke off: a loss of 15 is a CH3, a loss of 17 an OH, a loss of 29 a C2H5 or CHO.
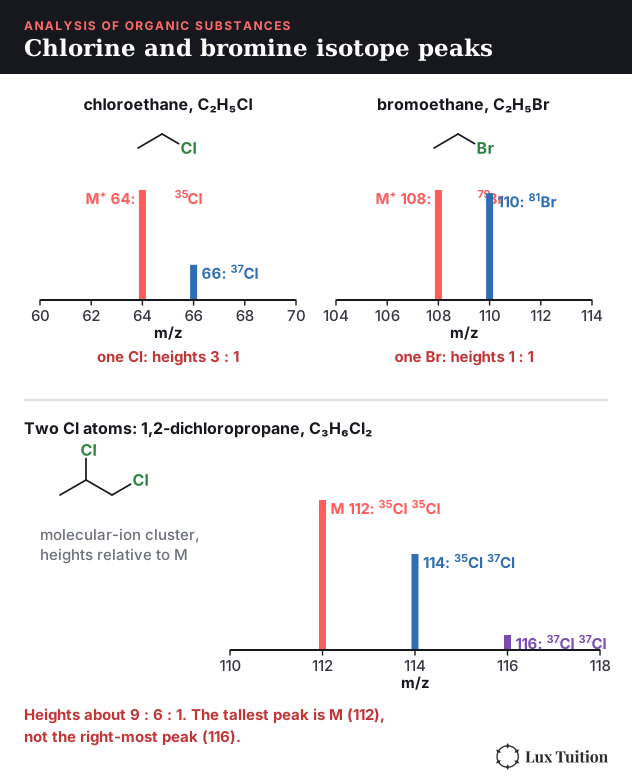
- Chlorine and bromine show up as pairs of peaks two units apart, because each has two common isotopes. Chlorine is about 75% 35Cl and 25% 37Cl, so an ion with one Cl gives peaks at M and M+2 in a 3 : 1 ratio. Bromine is about half 79Br and half 81Br, so one Br gives two equal peaks at M and M+2. With two Cl atoms you see three peaks, M, M+2 and M+4, in a ratio of about 9 : 6 : 1. The tallest is then the M peak (both atoms 35Cl), not the peak furthest to the right, so don’t pick the furthest-right peak automatically. The 2023 HSC question on a dichlorinated compound used m/z 114 and also accepted 112, so state which peak you used.
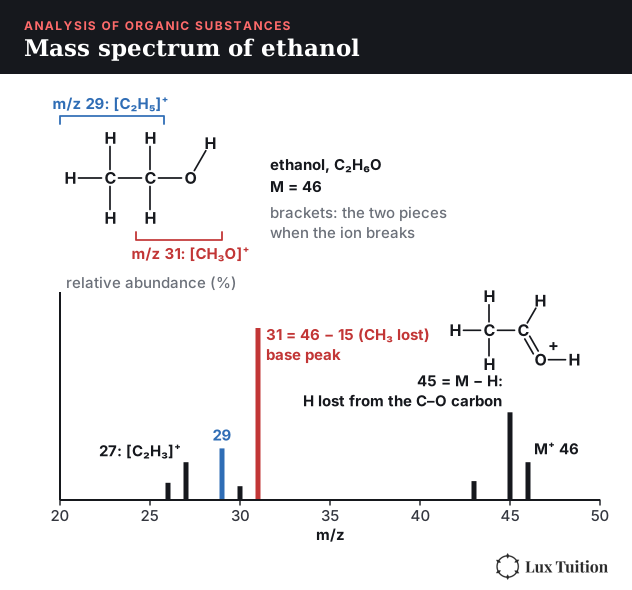
For ethanol, the molecular ion is at m/z 46, and the base peak at m/z 31 is the [CH3O]+ fragment, the carbon bonded to oxygen with its hydrogens, formed when the methyl group (15) breaks off.
How to read an infrared spectrum
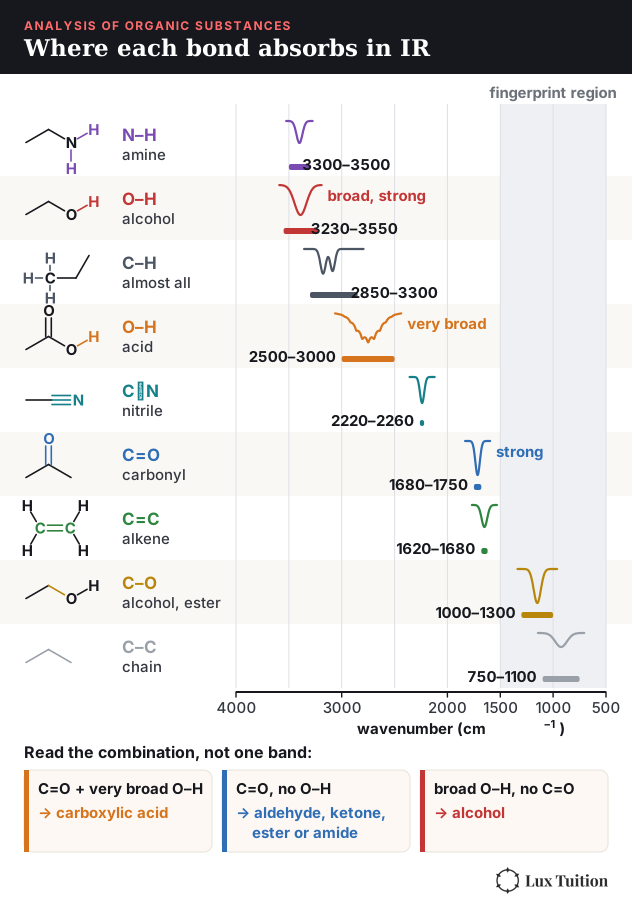
Covalent bonds vibrate, and each type of bond absorbs infrared light at a characteristic frequency, given as a wavenumber in cm−1. An IR spectrum plots transmittance against wavenumber, so each absorption shows as a dip.
The HSC data sheet lists the key absorptions, and Module 8 Figure 22 places each one on the wavenumber axis. The ones to recognise on sight are the broad, strong alcohol O–H (3230–3550 cm−1), the very broad acid O–H (2500–3000 cm−1), N–H in amines and amides (3300–3500 cm−1), C–H (2850–3300 cm−1 on the data sheet, 2850–3000 for alkane C–H, present in almost every organic molecule), the sharp, strong C=O of aldehydes, ketones, acids, esters and amides (1680–1750 cm−1) and C=C (1620–1680 cm−1).
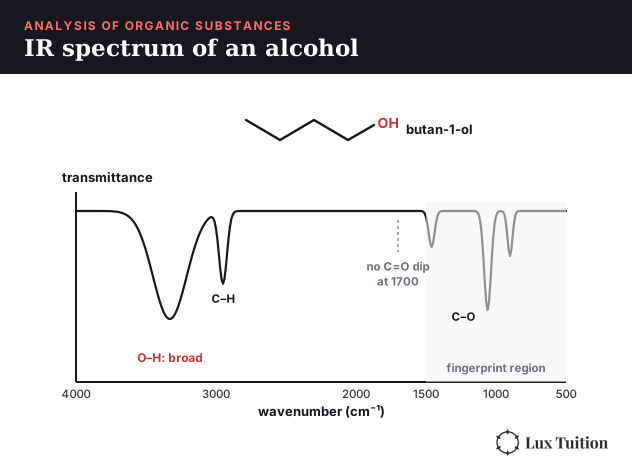
The region below about 1500 cm−1 is the fingerprint region, with a pattern unique to each molecule. It’s used to match an unknown against a reference spectrum, not to identify groups.
So IR tells you which functional groups are present: a C=O dip plus a broad O–H means a carboxylic acid; a C=O without O–H could indicate an aldehyde, ketone, ester or amide. Combine the molecular formula, other absorptions and NMR evidence to distinguish them.
How does carbon-13 NMR work?
Nuclear magnetic resonance (NMR) uses the fact that some nuclei, like 1H and 13C, behave like tiny magnets. In a strong magnetic field they absorb radio waves at frequencies that depend on their chemical environment, meaning the atoms around them. The position of each signal is its chemical shift (δ) in ppm, measured relative to a reference compound, TMS (tetramethylsilane), set at 0 ppm.
In a 13C NMR spectrum:
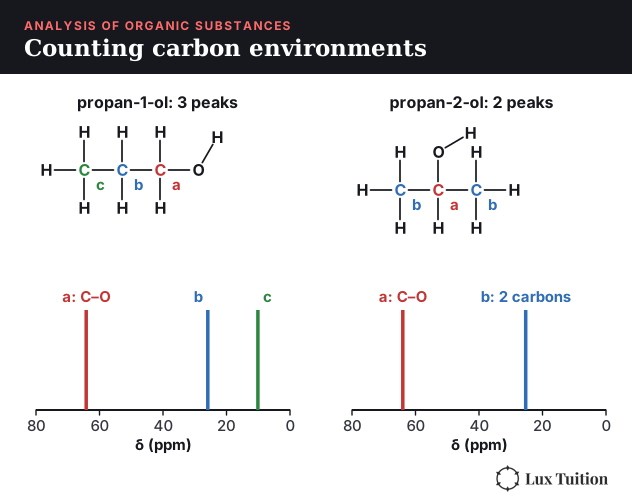
- The number of peaks equals the number of different carbon environments. Carbons in identical positions by symmetry give one peak.
- The chemical shift shows what each carbon is bonded to. Carbons near electronegative atoms appear further left (higher δ): about 5–40 ppm for C–C, 50–90 ppm for C–O, and 160–220 ppm for C=O. The data sheet gives the full table, charted in Module 8 Figure 24.
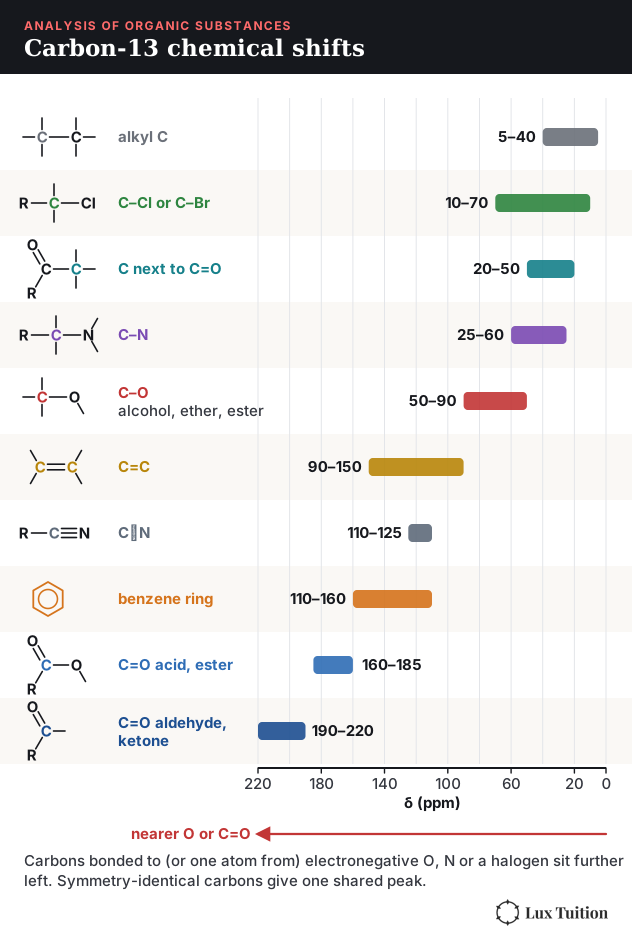
Propan-1-ol has 3 carbon environments, but propan-2-ol has only 2, because its two CH3 groups are identical. Propanone has 2 as well, with one peak above 200 ppm for the C=O.
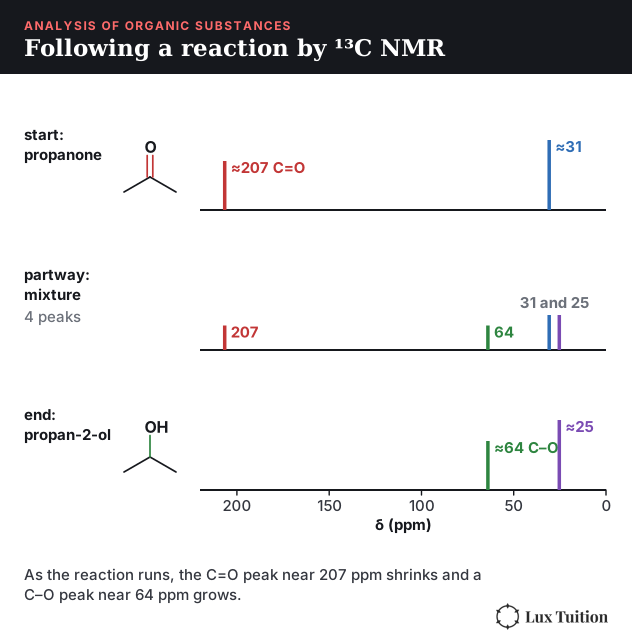
The same counting lets you follow a reaction. When propanone is reduced to propan-2-ol, the C=O peak near 207 ppm shrinks while a C–O peak near 64 ppm grows, and a sample taken partway through shows all four peaks.
How to read a proton (¹H) NMR spectrum
Proton NMR gives four pieces of information about the hydrogens:
- Number of signals (a split group counts as one signal) = number of different hydrogen environments, unless two environments have such similar shifts that they overlap.
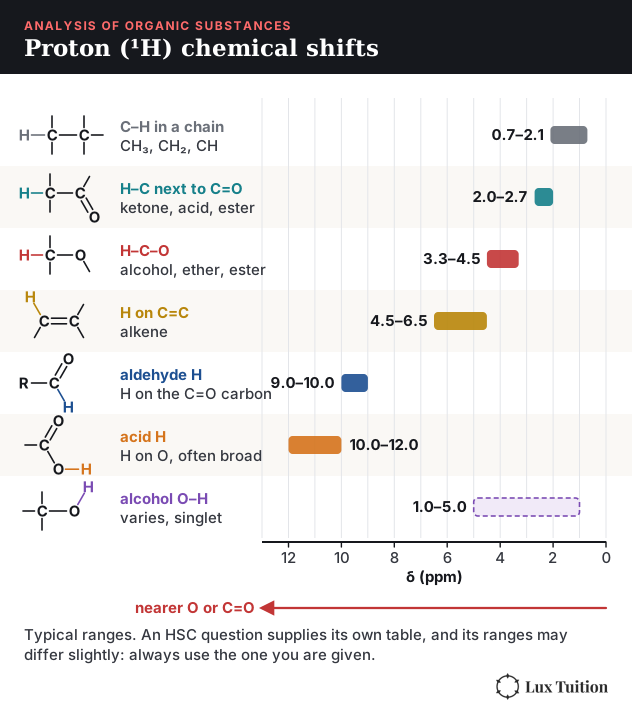
- Chemical shift (δ): hydrogens near electronegative atoms appear further left. Roughly 0.7–2.1 ppm for C–H in a hydrocarbon chain (most CH3/CH2 at 0.9–1.5), 2–2.7 ppm on a carbon next to C=O, 3.3–4.5 ppm on a carbon bonded to O, 4.5–6.5 ppm on a C=C, 9–10 ppm for an aldehyde H and 10–12 ppm for a carboxylic acid H (charted in Module 8 Figure 27). An HSC question supplies its own table, so use the one you are given.
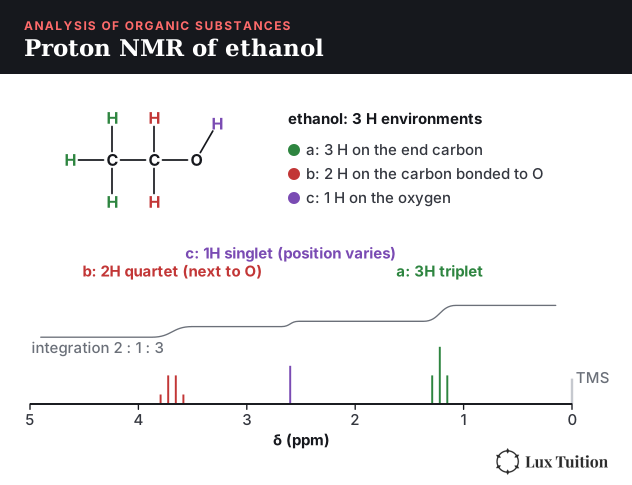
- Relative peak area (integration): the area of each peak is proportional to the number of hydrogens in that environment. (Integration measures area, so spectra show it as a stepped line whose step heights are in the ratio of the numbers of hydrogens, as in the ethanol spectrum (Module 8 Figure 29).) If two environments overlap into one signal, their areas add: a 2H environment and a 4H environment show as one 6H signal.
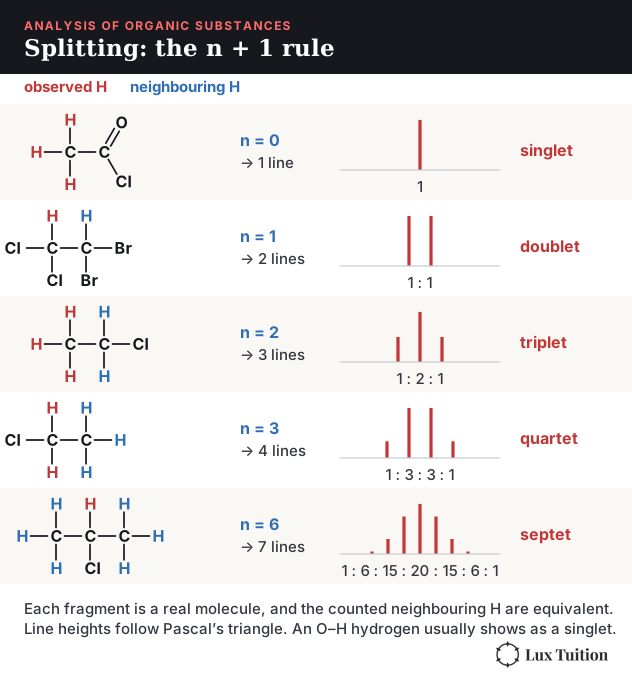
- Splitting pattern (the n + 1 rule): a peak is split by the hydrogens on the neighbouring carbons. If there are n neighbouring H, the peak splits into n + 1 lines: a singlet (0 neighbours), doublet (1), triplet (2), quartet (3).
For ethanol (Module 8 Figure 29):
- the CH3 (3H) is a triplet near 1.2 ppm, split by the 2 H on the CH2
- the CH2 (2H) is a quartet near 3.7 ppm, split by the 3 H on the CH3 and shifted left because it’s next to oxygen
- the OH (1H) is a singlet, because its hydrogen exchanges too quickly to split
No single instrument solves the structure. Mass spectrometry gives the molar mass, IR gives the functional groups, and NMR gives the carbon skeleton.
Combining spectra to identify a compound
Exam questions give several spectra of one unknown. A reliable order:
- Molar mass and formula: the molecular ion peak gives the molar mass; combine it with percentage composition, if given, to get the molecular formula.
- Functional groups: from the key IR absorptions (O–H, C=O, N–H).
- Carbon skeleton: count carbon environments in the 13C NMR, then use the proton NMR shifts, integrations and splitting to connect the pieces.
- Check: does your proposed structure predict every peak you were given?
Worked example. An unknown has its molecular ion at m/z 74. Its IR spectrum shows a very broad dip from 2500 to 3000 cm−1 and a strong dip at 1710 cm−1. Its 13C NMR has 3 peaks, near 180, 27 and 9 ppm. Its 1H NMR has a singlet at 11.7 ppm (1H), a quartet at 2.4 ppm (2H) and a triplet at 1.2 ppm (3H). All four spectra are drawn in Module 8 Figure 30, numbered in the order of the steps.

- IR: a very broad O–H across 2500–3000 plus C=O at 1710 means a carboxylic acid.
- Mass: the carboxyl group (the C=O carbon with its two oxygens and the acid H, red in the drawn structure) accounts for 45 of the 74, leaving 29, which is C2H5, an ethyl group. So the molecular formula is C3H6O2. The peaks at 45 and 29 are those two pieces, and 57 is the molecular ion minus OH (17).
- 13C NMR: 3 carbon environments, with the one near 180 ppm being the C=O.
- 1H NMR: the 11.7 ppm singlet is the acid H. A quartet (2H) next to a triplet (3H) is the signature of an ethyl group (a CH3 bonded to a CH2), with the CH2 shifted to 2.4 ppm because it’s next to the C=O.
The compound is propanoic acid, C3H6O2 (M = 74.08), drawn in full in Module 8 Figure 30. Checking it: 3 carbons in different environments, 3 hydrogen environments in a 3 : 2 : 1 ratio, and the acid’s O–H and C=O are both present.
Second worked example: a ketone. Many questions turn on a C=O with no O–H, on symmetry and on unusual splitting. An unknown has its molecular ion at m/z 86 and its base peak at m/z 43. Its IR spectrum shows a strong dip at 1715 cm−1 and no broad O–H. Its 13C NMR has 4 peaks, near 212, 42, 27 and 18 ppm. Its 1H NMR has a septet at 2.6 ppm (1H), a singlet at 2.1 ppm (3H) and a doublet at 1.1 ppm (6H).
- IR: C=O but no O–H, so it is not an acid or an alcohol. There is no aldehyde H near 9–10 ppm, so it is a ketone (or an ester).
- Mass and formula: M = 86, but mass alone cannot fix the formula, because other formulas such as C4H6O2 also have a mass of 86. Combine the evidence. The 1H integrations add to 1 + 3 + 6 = 10 H. The 13C spectrum shows the carbon skeleton: a ketone C=O near 212 ppm and, since symmetry makes two carbons share a peak, 5 carbons in 4 environments. Five carbons and ten hydrogens make 5 × 12 + 10 = 70, leaving 16 of the 86 for one oxygen, the ketone oxygen, so the formula is C5H10O. The peak at 71 is a loss of 15 (a CH3), and the base peak at 43 is the C2H3O+ ion, a CH3 still attached to the C=O.
- 13C NMR: 5 carbons but only 4 peaks, so two carbons are identical. The peak near 212 ppm is a ketone C=O.
- 1H NMR: a doublet (6H) with a septet (1H) is the signature of two identical CH3 groups on one CH (n + 1: the 6 H have 1 neighbour, the 1 H has 6). The 3H singlet is a CH3 with no neighbouring H, shifted to 2.1 ppm because it is bonded to the C=O.
The compound is 3-methylbutan-2-one, C5H10O (M = 86.13), the compound in the 2022 HSC spectra question.

What Are the Implications for Society of Chemical Synthesis and Design?
What factors go into designing a chemical synthesis?
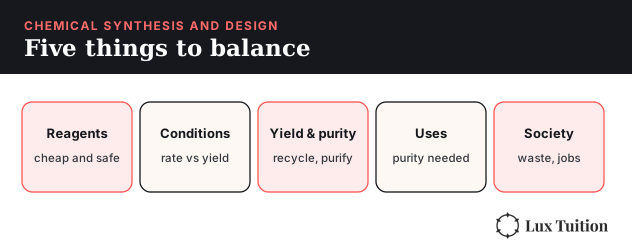
Industrial chemists have to balance many factors at once. The main ones:
- Availability of reagents: raw materials should be cheap, plentiful and safe to transport. Ammonia production relies on N2 from air and H2 from natural gas.
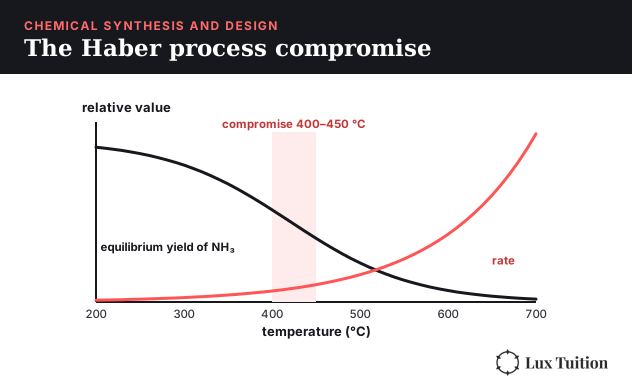
- Reaction conditions: temperature, pressure and concentration affect both the rate and the equilibrium yield, while a catalyst affects the rate without changing the equilibrium yield (Module 5). Higher temperature speeds a reaction up but lowers the yield of an exothermic one, and high pressure costs money and adds safety risk, so industry picks a compromise.
- Yield and purity: percentage yield = actual ÷ theoretical × 100. Recycling unreacted reagents raises it. Purity matters most for medicines, where impurities can be harmful, so extra purification steps are worth the cost.
- Industrial uses: what the product is for sets the quality needed and so the process. Pharmaceuticals must be extremely pure, so they justify slow, expensive purification and small batches. Cosmetics need consistent purity and must be safe on skin. Cleaning products such as soap are made in bulk from cheap fats and NaOH, where low cost matters more than high purity. Fuels are made on an enormous scale, so energy use, raw material cost and yield dominate.
- Environmental, social and economic issues: waste and by-products, energy use and emissions, safety of workers and nearby communities, jobs created, and whether the product is affordable. Green chemistry aims to reduce waste, use renewable feedstocks, and design safer chemicals and processes.
How to calculate atom economy and percentage yield
Atom economy measures how much of the reactants’ mass ends up in the product you want, if the reaction worked perfectly:
atom economy = molar mass of desired product ÷ total molar mass of all reactants × 100
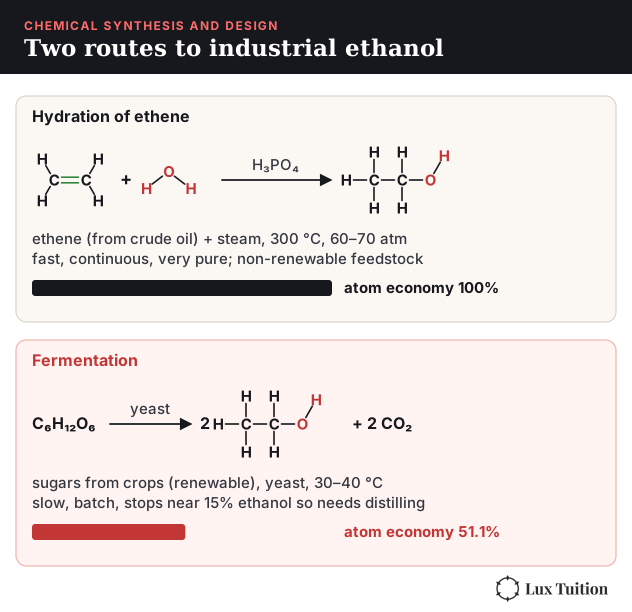
Use the balanced equation, including the coefficients. Making ethanol by hydrating ethene, C2H4 + H2O → C2H6O, has an atom economy of 100%, because every atom ends up in the ethanol. Making it by fermentation, C6H12O6 → 2C2H6O + 2CO2 (both equations are drawn with full structures in Module 8 Figure 34), has an atom economy of 2 × 46.07 ÷ 180.16 × 100 = 51.1%, because the CO2 is a by-product. Green chemistry favours routes with high atom economy, since there’s less waste to deal with.
Percentage yield is different: it measures how much product you actually got, compared with the most you could get from the limiting reagent.
Worked example. 6.00 g of ethanoic acid is refluxed (heated with a condenser so vapour drips back into the flask) with 5.00 g of ethanol, giving 5.28 g of ethyl ethanoate.
- n(ethanoic acid) = 6.00 ÷ 60.05 = 0.0999 mol; n(ethanol) = 5.00 ÷ 46.07 = 0.109 mol.
- They react 1 : 1, so ethanoic acid is the limiting reagent.
- Theoretical mass of ethyl ethanoate = 0.0999 × 88.11 = 8.80 g.
- Percentage yield = 5.28 ÷ 8.80 × 100 = 60.0%.
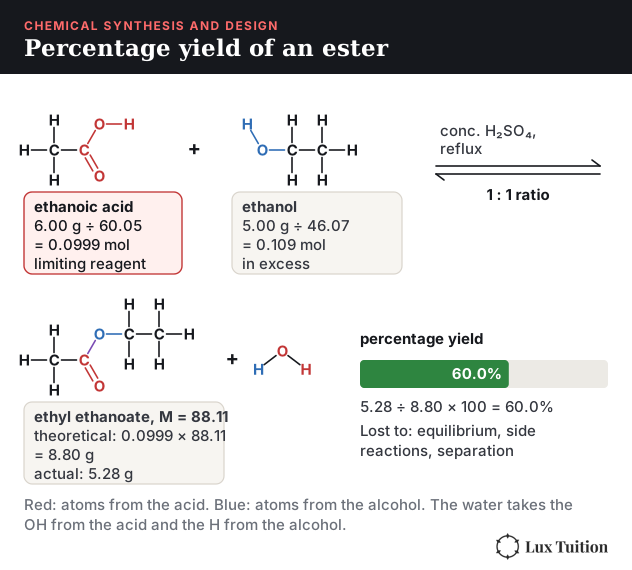
A yield below 100% comes from the equilibrium not going to completion, side reactions, and product lost while it is being separated and purified.
Case study: making ethanol industrially
Ethanol shows how the same product can be made by two very different processes:
- Hydration of ethene: ethene from crude oil reacts with steam at about 300 °C and 60–70 atm over a phosphoric acid catalyst. It’s fast, continuous and gives very pure ethanol, and recycling the unreacted ethene raises the overall conversion to about 95%. But it uses a non-renewable feedstock and a lot of energy.
- Fermentation: sugars from crops such as sugarcane are fermented by yeast at 30–40 °C. It uses a renewable feedstock and low temperatures, but it is slow, works in batches, stops at about 15% ethanol so it needs energy-hungry distillation, and has a lower atom economy.
Which route wins depends on the price of oil versus crops, and on how much the environmental cost of each is valued.
Two other processes appear in exam questions. The Ostwald process for nitric acid oxidises ammonia over a platinum–rhodium catalyst at about 850 °C, then converts the nitrogen monoxide to NO2 and absorbs it in water. Methanol is made from CO and H2 (CO + 2H2 ⇌ CH4O, ΔH < 0) at about 250 °C and 50–100 atm over a copper-based catalyst, the same rate-versus-yield compromise as the Haber process.
Case study: the Haber process
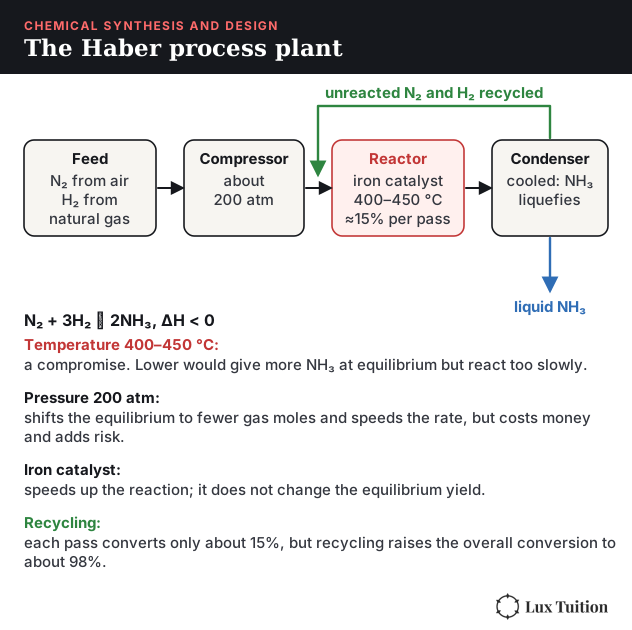
The Haber process, N2 + 3H2 ⇌ 2NH3 (ΔH < 0), shows these trade-offs in action:
- Temperature about 400–450 °C: a lower temperature would give more ammonia at equilibrium, but it would be too slow, so this is a compromise between rate and yield.
- Pressure about 200 atm: high pressure shifts the equilibrium towards the side with fewer gas moles, but higher pressures need expensive, thick-walled equipment.
- Iron catalyst: speeds up the reaction without changing the equilibrium position.
- Recycling: ammonia is liquefied and removed, and unreacted N2 and H2 are recycled, so the overall conversion approaches 98% even though each pass gives only about 15%.
The ammonia goes on to make fertilisers (feeding billions of people), explosives and nylon, so one synthesis has enormous social, economic and environmental effects.
Working Scientifically skills for Module 8
Module 8 is the most practical module in the course, so a lot of its marks reward Working Scientifically skills (the investigating and communicating skills in the syllabus: questioning, planning, collecting data, analysing and communicating). You are asked to read a graph, judge a method, or decide whether a result is believable. This section teaches those skills using Module 8 examples. Numbers marked illustrative are made up to show the method, not real results.
Hypotheses: a testable prediction
A hypothesis is a testable statement that predicts how one thing affects another. A useful hypothesis identifies measurable variables and predicts a relationship. Giving its direction makes the prediction more specific. “Absorbance changes with concentration” can be tested, but it is a weak prediction because almost any result fits it. “Absorbance increases as the concentration of Cu²⁺ increases from 0.05 to 0.30 mol L⁻¹” can be shown to be right or wrong, because the prediction covers the range you test. Starting with “because…” (for example, because more ions absorb more light) is a helpful scaffold, but a mechanism isn’t required. If your data disagree, you modify the hypothesis using the evidence, instead of ignoring the result. For instance, if absorbance stops rising at high concentration, you would limit the hypothesis to the range where the line is straight.
Forming an investigable question
A good inquiry question names a measurable quantity you can change and a measurable quantity you can observe. “How does pH affect the colour of the complex?” is vague. “How does the absorbance of a Cu²⁺ solution at a fixed wavelength change as its concentration increases from 0.05 to 0.30 mol L⁻¹?” is investigable, because both variables can be measured with the equipment you have. Check that the question can be answered safely, in the time and with the equipment available.
Variables and controls
- The independent variable (IV) is the one thing you change. The dependent variable (DV) is what you measure. Controlled variables are everything else you keep the same.
- For a colourimetry investigation: IV = concentration of the standard; DV = absorbance; controlled = wavelength, the same cuvette (so the path length l stays the same), the same instrument and temperature.
- An experimental control is a comparison run that shows what happens without the IV. In colourimetry, the blank (solvent only, 0.0 concentration) is the control: it should read about zero, and it zeroes the instrument.
- Replicates are separately prepared samples (you make the solution again and measure it again). A repeat is measuring the same sample again. Replicates show whether your preparation is consistent; repeats show whether your measuring is.
Planning: risk, ethics and materials
For every hazard, state the hazard, the possible harm, and a specific precaution. “Be careful” earns nothing.
- Silver nitrate stains skin and is toxic to aquatic life, so wear gloves and goggles and collect the silver waste instead of washing it down the sink.
- Bromine water is corrosive and its vapour is harmful to breathe, so use small amounts in a well-ventilated area or fume cupboard, and wear gloves and goggles.
- Lead salts and barium salts are toxic, so students should use a teacher demonstration or secondary data, and waste is collected for disposal.
Ethics in this module is mostly environmental: collect water samples only with permission, don’t release heavy-metal waste, and report results honestly. Materials and method need a sensible order. In the 2023 HSC anion question, the marks rewarded a testing sequence with a reason for each step (carbonate first, because it would give a false positive with silver) plus the expected observations. The ordering logic is in How to test for anions.
Accuracy, precision, validity and reliability
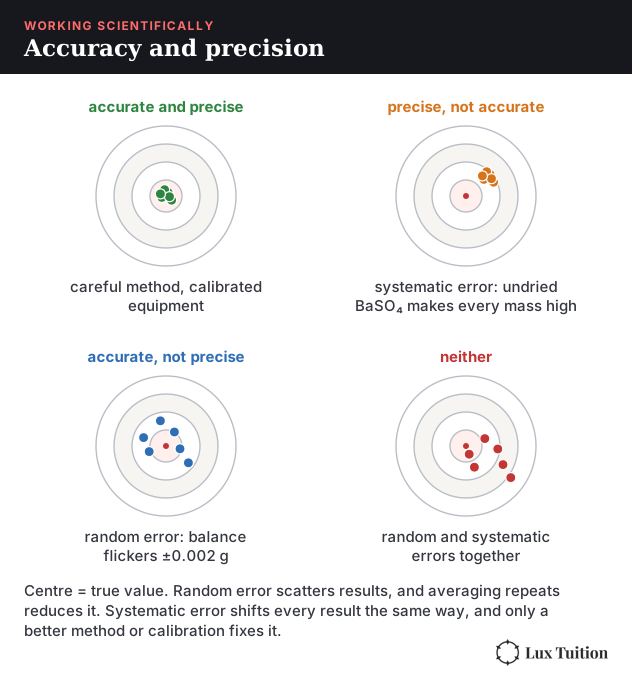
- Accuracy: how close a result is to the true value. Precision: how close repeated measurements are to each other. A dirty cuvette gives precise but inaccurate readings.
- Validity: the investigation really answers the question it claims to. A colourimetry result is only valid if the wavelength suits the substance and only the concentration changes.
- Reliability: repeating the investigation gives consistent results.
- Calibration checks an instrument against known values. A calibration curve is calibration made visible: the standards show how your instrument responds, so the unknown is read against it. The instrument is zeroed with a blank first.
Uncertainty and error
- Random error makes results scatter either side of the true value (for example, reading a burette meniscus slightly differently each time). Averaging independent repeats reduces it.
- Systematic error pushes every result the same way: a constant offset (a balance that has not been zeroed and reads 0.05 g too high every time) or a proportional one (a standard solution made 5% too strong). Residual water left in a pipette is a different case: it dilutes the solution, so it is a method error that changes the concentration. Averaging cannot remove it. You fix it with calibration or a corrected method.
- Example (gravimetric analysis): if the precipitate is not dried to constant mass, leftover water makes the mass too high every time, which is a systematic error. A balance that flickers by ±0.002 g is random.
- Uncertainty is the size of doubt about a measurement. As an illustrative example, a 25 mL pipette with an uncertainty of ±0.05 mL has a percentage uncertainty of 0.05 ÷ 25 × 100 = 0.2%. The same uncertainty is a bigger percentage of a small volume, so measure larger quantities where you can.
- In titrations, concordant titres (usually within 0.10 mL) show good precision. Average only those.
Evaluating and improving an investigation
The 2021 HSC asked students to judge a sequence of tests for identifying an unknown salt. The marking guideline rewards listing positive and negative aspects and then making an informed judgement. The sample answer pointed out that one test was not needed, because sodium never precipitates with the possible anions and chloride never precipitates with the possible cations, while the silver ion test was a good choice. The method that works:
- For each step, say what it detects and whether the result changes the decision.
- Name strengths (selective, simple, clear observation) and weaknesses (unnecessary, a false positive, a missed ion).
- Finish with a clear judgement, then suggest a change (remove, reorder or replace a test) that would improve validity, reliability or safety.
Presenting data: choosing and drawing graphs
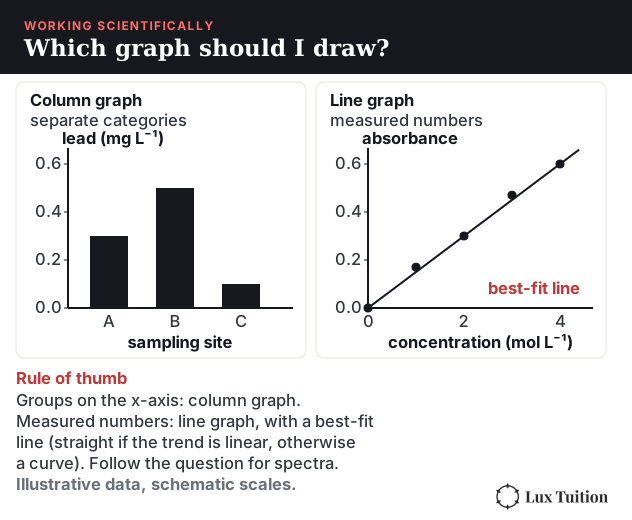
Data are categorical when they sort into groups (sampling sites, metal ions) and continuous when they are measured numbers that can take any value (concentration, absorbance). Use a column graph for categories and a line graph for continuous data. Continuous does not mean straight: draw a straight best-fit line when the relationship is linear, and an appropriate smooth curve when it is not.
The 2019 HSC gave absorbance data for two metals and asked for calibration curves (7 marks). The marking guideline rewarded these graph features:
- Label both axes with the quantity and unit. Put the independent variable (concentration) on the x-axis and the dependent variable (absorbance) on the y-axis. Absorbance has no unit.
- Use an even scale that fills most of the grid, with equal steps (0, 1, 2, 3…), not squashed into one corner.
- Plot every point for both data sets.
- Draw a line of best fit (straight here, because calibration data are linear) through the trend, with points scattered either side. Don’t join the dots when showing a relationship or making predictions. (For spectra, time series, or when the question gives an instruction, follow the question.)
- Use a different symbol for each data set and add a key.
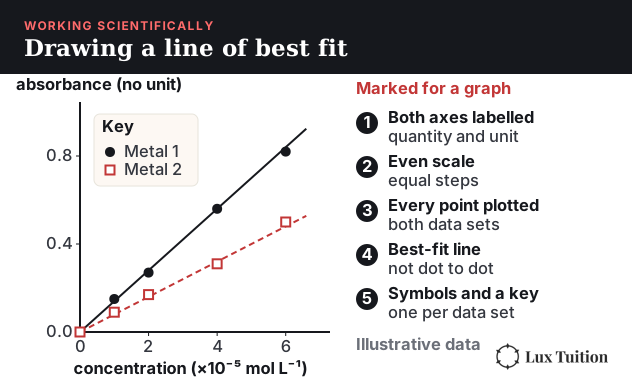
The graph was only part of the question. The rest rewarded reading each unknown from its curve, converting mol L⁻¹ to mg L⁻¹ (see Why do we monitor the environment?), comparing to the discharge limit and judging how effective the treatment was. A graph is a tool for a decision, so always finish by answering the question that was asked.
Interpolation (reading a value between your standards) is reliable. Extrapolation (reading beyond them) is not, because the line might bend. That’s why an unknown must sit inside the calibration range, as in How does colourimetry work?.
Quantitative methods
- Keep units in every line and convert mg L⁻¹, g L⁻¹ and mol L⁻¹ carefully.
- Keep significant figures consistent with the data given (the 2019 and 2022 guidelines award a mark for this), and round only at the end.
- Show main steps so marks can be awarded even if the last number is wrong. Back titrations and gravimetric percentages follow the same layout: moles first, then the ratio, then the answer.
Models and secondary sources
A model is a simplified picture used to explain or predict. The n + 1 rule for NMR splitting and the 9 : 6 : 1 pattern for two chlorine atoms are models: they work for simple cases, so state when a model might fail (an OH proton, or overlapping signals).
Secondary sources are information someone else collected, such as a spectrum database or a guideline value. Check who published it, how recent it is and whether it matches your conditions. The drinking-water limit for lead was once 0.01 mg L⁻¹ and is now 0.005 mg L⁻¹, so an old table can mislead. In an exam, use the limit you are given.
When you use a secondary source, reference it so that someone else can find it: author or organisation, title, year, link and the date you accessed it, set out the same way every time. For example, in Harvard style: National Health and Medical Research Council (2025) Australian Drinking Water Guidelines: lead, NHMRC, accessed 17 October 2026, https://guidelines.nhmrc.gov.au/australian-drinking-water-guidelines/part-5/physical-chemical-characteristics/lead.
A quick peer check also helps before you finish a report. Swap with a classmate, who checks that axes are labelled with units, that the conclusion matches the data, and that someone could repeat the method from your steps alone. Then fix what they find.
Evidence-based arguments
A claim is backed by evidence and a reason linking them. “The unknown contains chloride” is a claim; “a white precipitate formed with silver nitrate and dissolved in dilute ammonia” is the evidence; “AgCl is white and dissolves in dilute ammonia, while AgBr and AgI do not” is the reason. For “to what extent” questions, give your judgement with evidence for and against, such as a result that is below the limit but close to it.
Command words: what the question wants
These are guides, not formulas: read the whole question and its marks.
- Identify / state: give the name or fact, with no explanation.
- Outline: give the main points briefly.
- Describe: give characteristics and features, such as the test and the expected observation.
- Explain: give the reason, using “because” or “so”.
- Analyse: break the information into parts and show the relationships and trends, using evidence from the data or spectrum.
- Discuss: give considerations for and against, with evidence and implications, and reach a conclusion.
- Assess / evaluate: make a judgement supported by evidence, usually weighing strengths and limitations.
- Justify: support a choice or conclusion with reasons and evidence.
The full list is in the NESA glossary of key words. Match the effort to the marks: 1 mark is usually one idea. Use the command word and the marking demands: seven marks may reward calculations, graphs, structural deductions or an extended explanation.
HSC Chemistry Module 8 Revision Summary
How Does Module 8 Fit the Rest of HSC Chemistry?
Module 8 is the most cumulative module in the course, so it’s worth revising alongside the others:
- The precipitation, Ksp and Haber process equilibrium ideas come from our HSC Chemistry Module 5 notes.
- Titration technique and standard solutions come from our Module 6 notes.
- The functional groups being tested and analysed come from our Module 7 notes.
For the bigger picture, our ultimate guide to scoring Band 6 in Chemistry covers how to study the HSC course, and how I hacked HSC Chemistry covers how to use past papers.
HSC Chemistry Tutoring in Blacktown
Module 8 questions often combine three or four modules in one long response, which is where students lose the most marks. In our HSC Chemistry tutoring in Blacktown, theory is broken down by our tutors into the smallest possible parts and practised in classes of 1 to 5 students, a few minutes from Blacktown Station. Check our pricing page, or book a free trial with no obligations.
Frequently Asked Questions
What is Module 8 in HSC Chemistry?
Module 8 is Applying Chemical Ideas, the last of four Year 12 modules in the NSW Chemistry Stage 6 Syllabus. It covers identifying and measuring ions, identifying organic compounds with chemical tests and spectroscopy, and the factors involved in designing a chemical synthesis.
What are the flame test colours in HSC Chemistry?
Barium gives an apple-green flame, calcium a brick-red flame and copper a blue-green flame. Magnesium, lead, silver and iron don't give useful flame colours, so they are identified with precipitation and complexation tests instead.
What is the difference between AAS and colourimetry?
Both measure concentration from absorbance using a calibration curve. Colourimetry measures a coloured solution with light of one colour. AAS atomises the sample in a flame and uses a lamp made of the target metal, so it measures one specific metal, even at parts-per-million levels, with very little interference from other metals.
What does each spectroscopy technique tell you?
Mass spectrometry gives the molar mass from the molecular ion peak and clues from fragments. Infrared spectroscopy shows which bonds and functional groups are present, such as O–H and C=O. Carbon-13 NMR counts the carbon environments, and proton NMR shows hydrogen environments, how many hydrogens are in each, and their neighbours through splitting.
What is the n + 1 rule in proton NMR?
A proton NMR signal is split into n + 1 lines, where n is the number of hydrogens on the neighbouring carbon atoms. A CH₃ next to a CH₂ appears as a triplet, and the CH₂ next to that CH₃ appears as a quartet. Hydrogens on OH groups usually appear as singlets.
What factors affect the design of a chemical synthesis?
The syllabus lists availability of reagents, reaction conditions, yield and purity, industrial uses, and environmental, social and economic issues. Real processes like the Haber process use compromise conditions that balance reaction rate, equilibrium yield, cost and safety.
Learn it properly with a specialist tutor at Blacktown or online across NSW. Enquire about a free trial — no cost, no obligation. See online formats and class sizes.
Realistic study tips to help you prepare better for assessments with less stress, plus a printable study planner