
What happens when chemical reactions do not go through to completion? That’s the question Module 5 opens with, and it’s the idea the rest of Year 12 Chemistry is built on. Soft drinks going flat, fertiliser factories, blood pH and the acid calculations of Module 6 all come back to one idea: many reactions run forwards and backwards at the same time. This page is part of our HSC Chemistry notes, which summarise all four Year 12 modules in one place.
These HSC Chemistry Module 5 notes follow the four inquiry questions of Module 5: Equilibrium and Acid Reactions in the NSW Chemistry Stage 6 Syllabus. They’re written from the lessons our tutors teach in class, and each topic opens with the exact syllabus dot point it covers. Module 5 leans hard on the entropy, enthalpy and Gibbs free energy from our Year 11 Chemistry Module 4 notes, so skim those first if ΔG = ΔH − TΔS feels rusty.
These are theory and revision notes with the key worked examples solved in full. Reading notes doesn’t replace the practical investigations the syllabus asks you to do in class.
Key Takeaways
- A reversible reaction is two reactions happening at the same time. In a closed system it reaches dynamic equilibrium when the forward rate equals the reverse rate.
- Le Chatelier’s principle: if an equilibrium is disturbed, the equilibrium position moves to counteract the change. Collision theory explains why.
- A catalyst gets a system to equilibrium faster but does not change the equilibrium position.
- The equilibrium constant (K) is the ratio of products to reactants at equilibrium. K > 1 favours products, K < 1 favours reactants, and only temperature changes K.
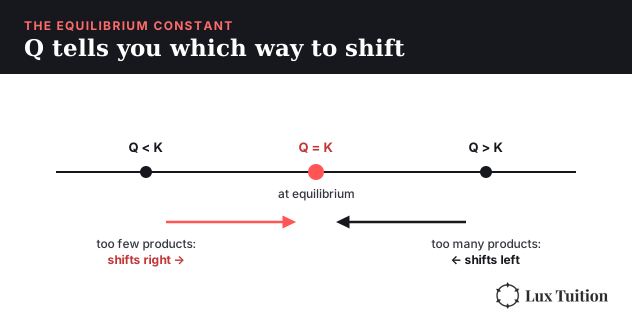
- The reaction quotient (Q) uses the same expression at any moment: Q < K shifts right, Q > K shifts left.
- Ksp (the solubility product) describes a saturated ionic solution. If Qsp (the same ratio at any moment) > Ksp when two solutions are mixed, a precipitate forms.
For how to study all this effectively, see how to actually understand HSC Chemistry.
What Does HSC Chemistry Module 5 Cover?
Module 5 is the first of four Year 12 modules in the NESA Chemistry Stage 6 Syllabus (2017). It’s organised around four inquiry questions, and these notes follow the same order:
| Syllabus section | Inquiry question |
|---|---|
| Static and Dynamic Equilibrium | What happens when chemical reactions do not go through to completion? |
| Factors that Affect Equilibrium | What factors affect equilibrium and how? |
| Calculating the Equilibrium Constant (Keq) | How can the position of equilibrium be described and what does the equilibrium constant represent? |
| Solution Equilibria | How does solubility relate to chemical equilibrium? |
What Happens When Chemical Reactions Do Not Go Through to Completion?
Irreversible reactions
The combustion of butane is a chemical reaction that is irreversible: the reactants convert to the products, but the products don’t convert back to the reactants.
2C4H10(g) + 13O2(g) → 8CO2(g) + 10H2O(l)
It’s just like a BBQ! Your food doesn’t un-BBQ itself. The forward arrow indicates the reaction only proceeds in one direction. Two more irreversible examples from the syllabus:
- Combustion of magnesium: 2Mg(s) + O2(g) → 2MgO(s). Pouring water on burning magnesium makes it burn even more, because the hot metal splits the water into oxygen-containing product and hydrogen gas: Mg(s) + H2O(g) → MgO(s) + H2(g), and the hydrogen then burns too. (The equation Mg(s) + 2H2O(l) → Mg(OH)2(s) + H2(g) is the slow reaction of magnesium with cold water.)
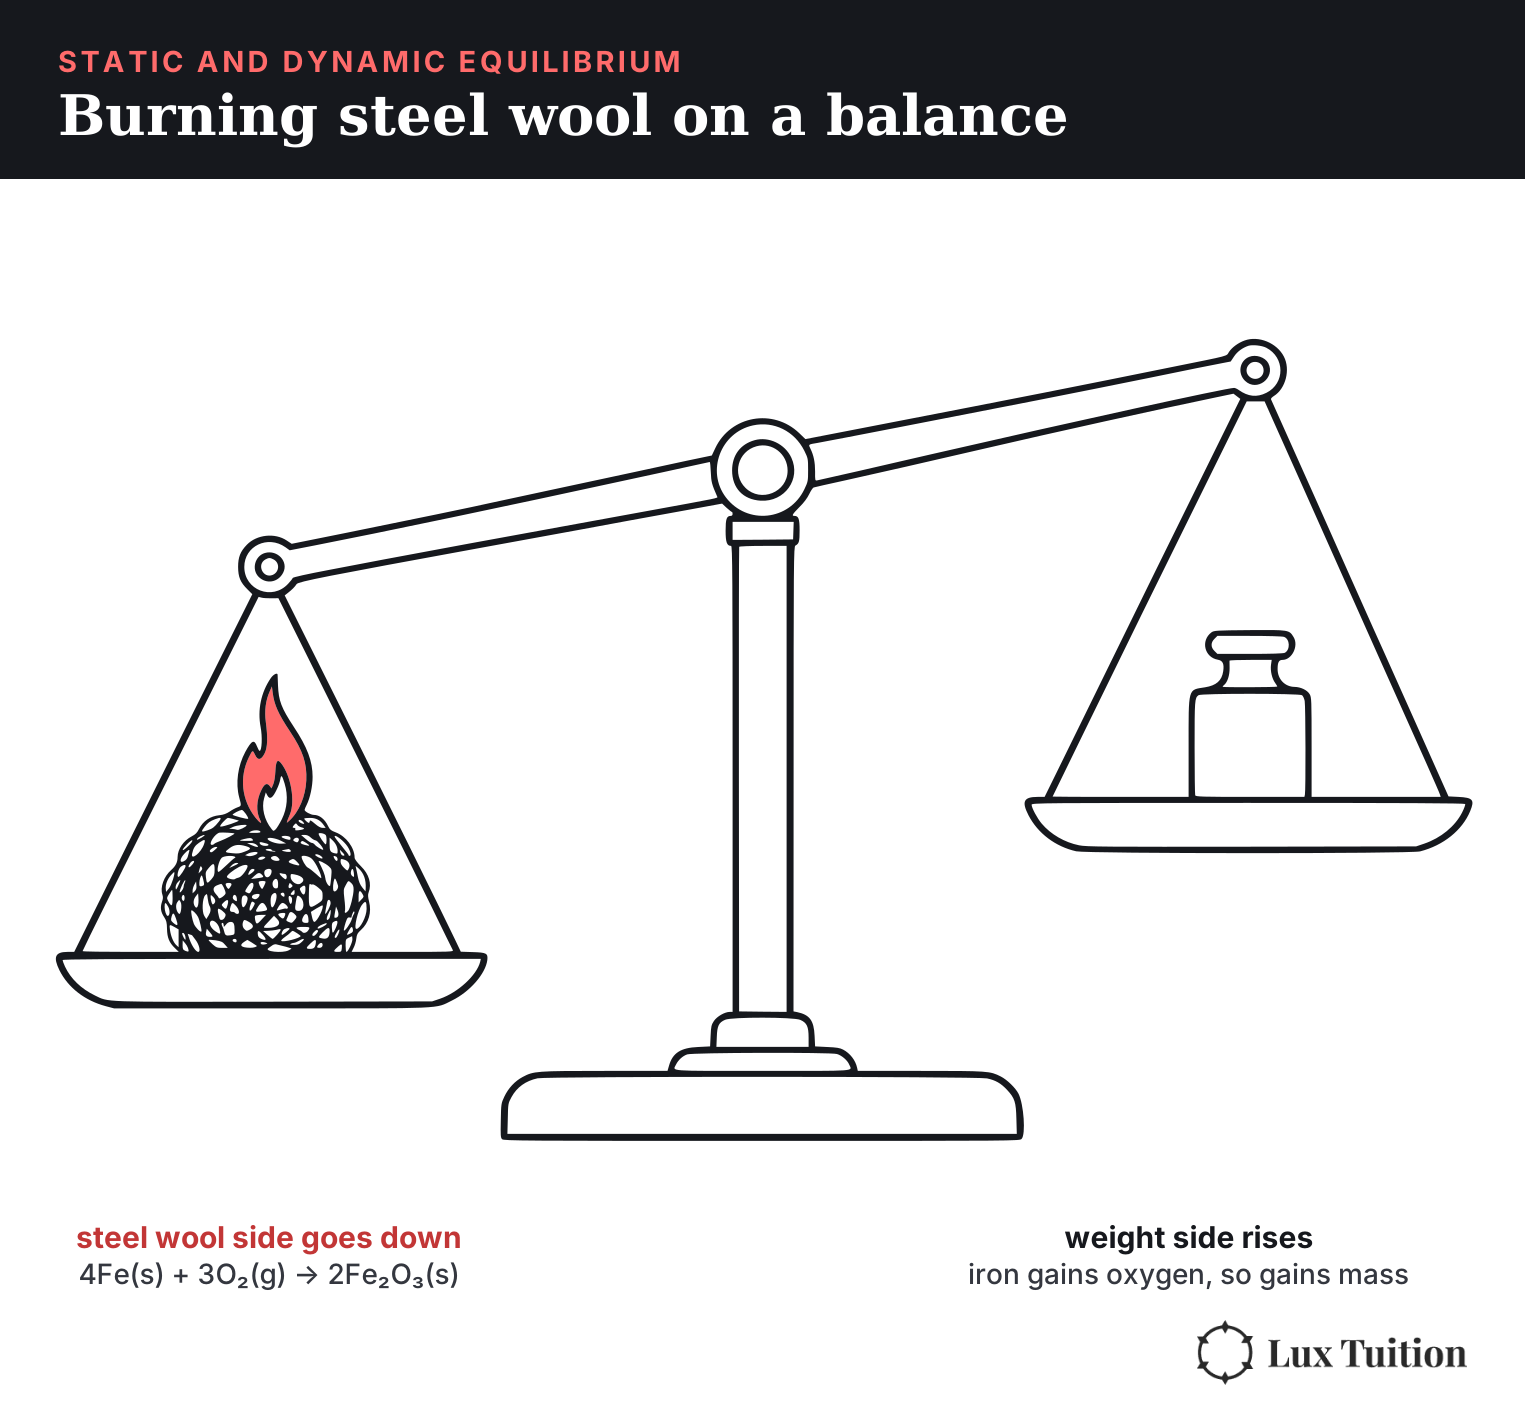
- Combustion of steel wool: 4Fe(s) + 3O2(g) → 2Fe2O3(s). Iron has been converted into a product that also has oxygen, increasing its mass! If you balance steel wool against a weight and burn it, the steel wool side goes down.
Reversible reactions
Many chemical reactions are reversible: the products can turn back into reactants. It’s like coming back from your BBQ and cleaning your room: Room(dirty) ⇌ Room(clean). Carbon dioxide dissolving in soft drinks is a real example:
CO2(g) ⇌ CO2(aq)
It’s a two for one special! Every reversible reaction is actually composed of two reactions happening at the same time:
- There is a forward reaction, where reactants are converted to products.
- There is a reverse reaction, where products are converted back to reactants.
The ⇌ is a reversible arrow, which indicates that the reaction has both a forward reaction and a reverse reaction. The two syllabus examples:
- Cobalt(II) chloride: anhydrous (containing no water) CoCl2 is blue, and hydrated CoCl2·6H2O is pink. CoCl2(s) + 6H2O(g) ⇌ CoCl2·6H2O(s)
- Iron(III) nitrate with potassium thiocyanate: Fe(NO3)3(aq) + KSCN(aq) ⇌ FeSCN2+(aq) + KNO3(aq) + 2NO3−(aq), or as a net ionic equation, Fe3+(aq) + SCN−(aq) ⇌ FeSCN2+(aq). FeSCN2+ has a blood red colour. A net ionic equation shows only the species that actually react. K+ and NO3− are spectator ions: they are in the solution but don’t take part, so they are left out.
You can see both reactions run in each direction:
- Cobalt(II) chloride. Gently heating pink CoCl2·6H2O drives off the water and it turns blue. Adding a few drops of water turns it pink again. This colour change is used in humidity-indicator paper and in the indicator beads mixed through silica gel packets: blue means dry, pink means the air is humid.
- Iron(III) thiocyanate. Adding more Fe3+ or SCN− deepens the red colour, and removing either ion makes it fade, so the reaction can be pushed backwards as well as forwards.
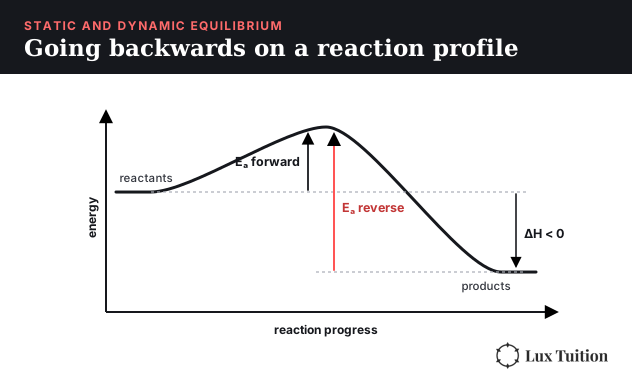
What’s stopping us from going backwards? Look at the reaction profile. Activation energy (Ea) is the minimum energy colliding particles need for a reaction to happen, shown as the height of the peak. The reverse of an exothermic reaction (one that releases heat) is endothermic (absorbs heat), and it has to climb a bigger activation energy barrier to get back over the top.
Open and closed systems
Everything involved in the reaction (products and reagents) can be thought of as the system. Everything else (including the rest of the universe) is the surroundings.
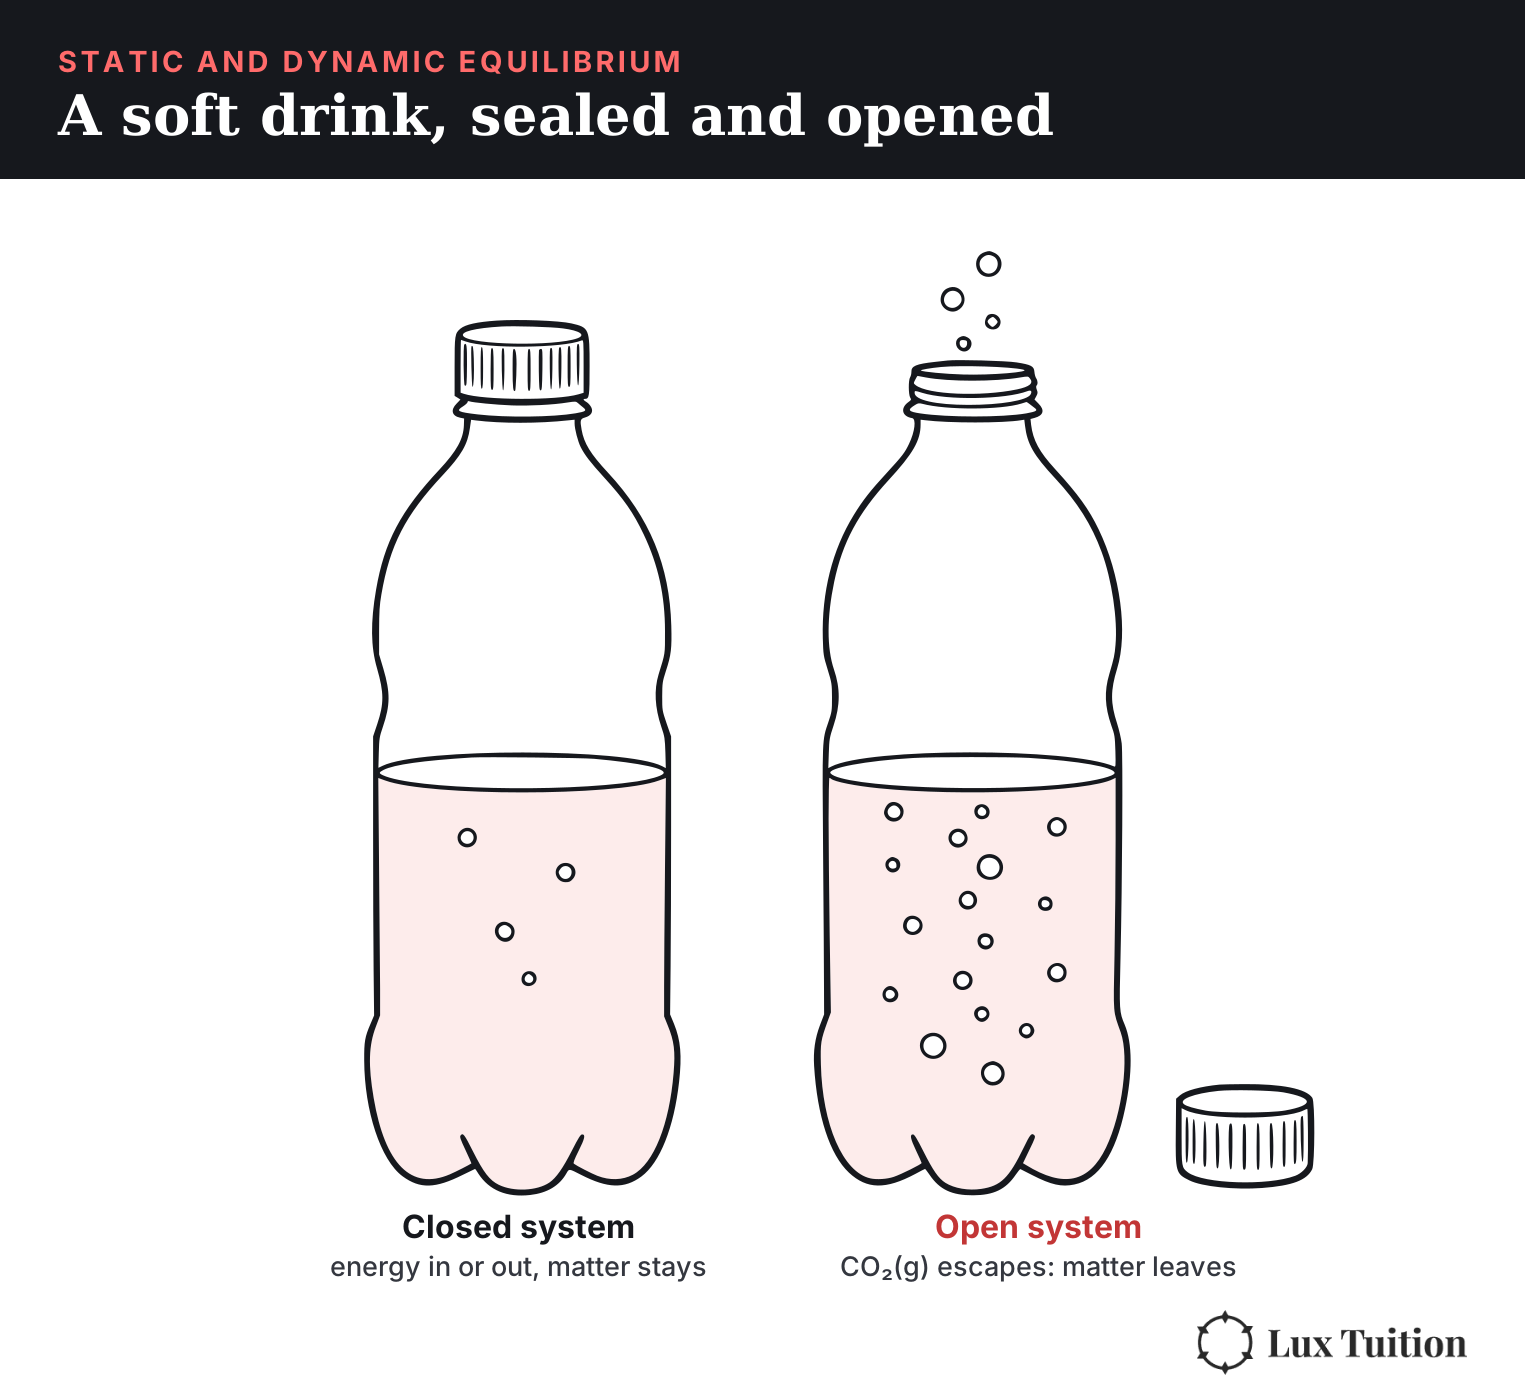
- An open system allows the transfer of matter and energy with its surroundings, e.g. an open flame, an open soft drink bottle.
- A closed system allows the transfer of energy, but not matter, with its surroundings, e.g. a hot water bottle, a saucepan with the lid on top, a closed soft drink bottle.
What is dynamic equilibrium?
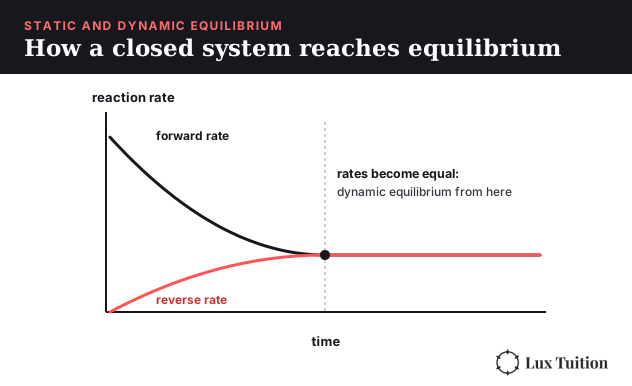
Closed systems of reversible reactions will eventually reach equilibrium when the rate of the forward reaction equals the rate of the reverse reaction.
Think about what happens when a soft drink bottle is opened for the first time: carbon dioxide gas is released. The gas comes from the dissolved carbon dioxide in the drink. But when the bottle was still sealed, there was no observable gas coming out. This is because the gas was dissolving back into the drink at the same rate that it came out: the system was in equilibrium.
Equilibrium can only occur in closed systems. Once we opened the bottle and allowed matter to be transferred out, the equilibrium was disrupted and the gas rushed out. This was because the rate of the reverse reaction (dissolved carbon dioxide becoming gas) became higher than the rate of the forward reaction (gaseous carbon dioxide dissolving).
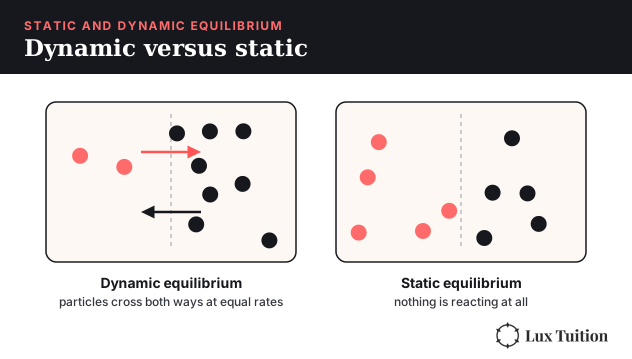
Chemical equilibriums are dynamic: the forward and reverse reactions are both happening at the same time, but they are equal, so there is no overall change in the system. This dynamic equilibrium is like someone who eats enough to maintain their weight (food coming in and energy going out are equal).
Static equilibrium
An equilibrium involving no forward or reverse reactions would be a static equilibrium. This would be like a statue of a person: its weight is (basically) constant as there is no loss and no gain.
Chemical equilibriums are never static, because every reversible reaction always has some forward and reverse reaction, even if one rate is extremely small. Even “diamonds are forever” is a lie: C(diamond) ⇌ C(graphite) favours graphite at room conditions, and the conversion is just unimaginably slow.
Recap: entropy, enthalpy and Gibbs free energy
These ideas are taught in full in our Year 11 notes on entropy and Gibbs free energy; here is the short version.
- Entropy (S) is the number of states available to a system. “States” is like how free the system is to “move around”, or how disordered the system is. A gas will have more entropy than a liquid, and a liquid will have more entropy than a solid. ΔSsystem = Sproducts − Sreactants.
- Enthalpy (H) is how much energy is contained in the products or reactants (as chemical bonds). ΔH = Hproducts − Hreactants. ΔH < 0 means exothermic and ΔH > 0 means endothermic.
- Gibbs free energy decides whether a reaction happens by itself: ΔG = ΔH − TΔS. The more negative ΔG is, the more spontaneous the reaction.
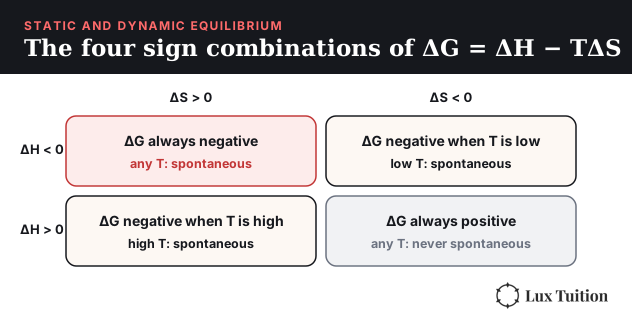
To maximise spontaneity, ΔH should be as negative as possible and ΔS as positive as possible, i.e. we want a very exothermic reaction that increases entropy greatly. If ΔH is positive and ΔS is negative, ΔG will never be negative. If both are positive, the reaction relies on a high T to be spontaneous. If both are negative, it relies on a low T.
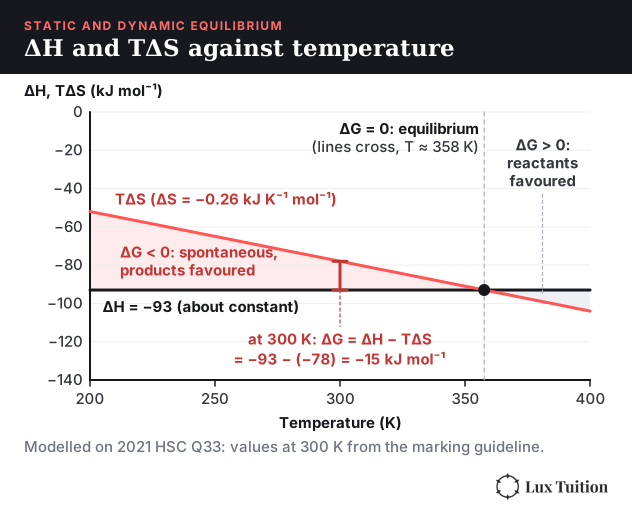
The point where a reaction switches between spontaneous and non-spontaneous is where ΔH = TΔS. There ΔG = 0 and the system is at equilibrium. On a graph of ΔH and TΔS against T, this is where the two lines cross.
Why are some reactions non-equilibrium systems?
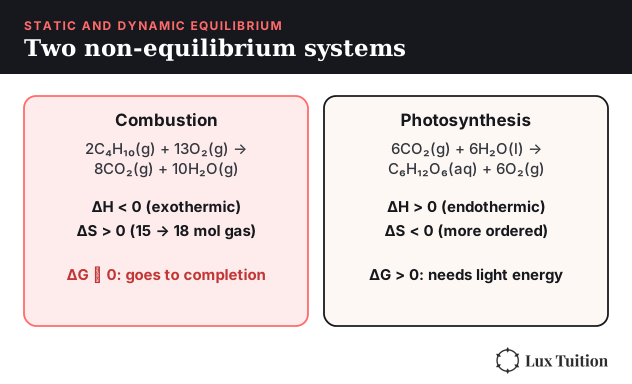
If we can just go backwards along a reaction profile to get the reverse reaction, why are some reactions irreversible? For combustion, the reverse reaction is so non-spontaneous (ΔG for it is hugely positive) that it effectively never happens, and in open systems like a flame the products escape anyway. The high activation energy of the reverse reaction adds to this. Under flame conditions the reverse reaction is negligible, so combustion does not establish an observable equilibrium. Photosynthesis is different: its forward ΔG is positive, so it only proceeds while light keeps supplying energy. Both are non-equilibrium systems.
- Combustion (butane): in a flame the water forms as steam, 2C4H10(g) + 13O2(g) → 8CO2(g) + 10H2O(g). Entropy increases because we start with 15 moles of gas and produce 18 moles of gas. Enthalpy decreases because this is an exothermic reaction, so the products have less energy than the reactants. With a negative ΔH and positive ΔS, ΔG is very negative: it is very spontaneous!
- Photosynthesis: 6CO2(g) + 6H2O(l) → C6H12O6(aq) + 6O2(g). Entropy decreases because six small gas molecules and six liquid molecules become one large glucose molecule plus six gas molecules. Enthalpy increases as this is an endothermic reaction. A positive ΔH and a negative ΔS give a positive ΔG, so photosynthesis will never spontaneously happen. Plants drive it with light energy.
Two exam-style checks from class:
- H2CO3(aq) → CO2(g) + H2O(l) is slightly endothermic, so ΔH is small and positive. But the reaction produces a mole of gas, which has much more entropy than an aqueous species, so ΔS is positive. The TΔS term outweighs ΔH, so ΔG is negative and it occurs spontaneously: it is entropy-driven.
- 2H2(g) + O2(g) → 2H2O(g) is exothermic, but the moles of gas decrease (3 to 2), so ΔS is negative. It will be spontaneous at low temperatures but non-spontaneous at high temperatures.
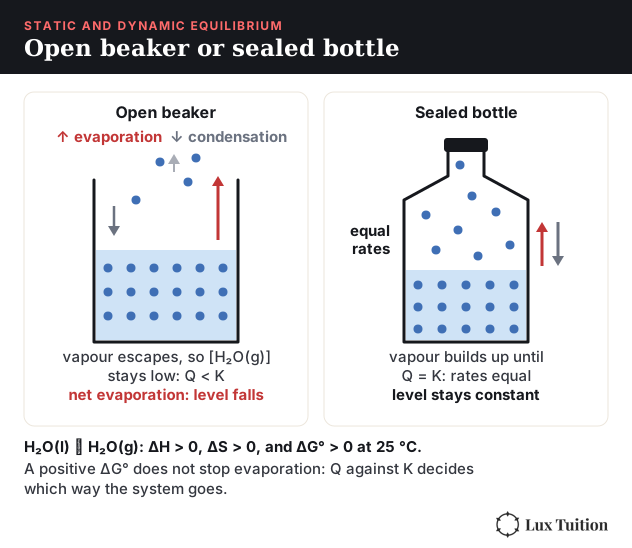
Open beaker or sealed bottle (2022 HSC Q36). Evaporation absorbs energy to overcome the attractions between water molecules, so ΔH > 0. Changing from liquid to gas also increases entropy, so ΔS > 0. At room temperature ΔH is bigger than TΔS, so the standard ΔG is positive. But a positive standard ΔG (ΔG°, the value under standard conditions) describes standard conditions, not every possible mixture. Vapour escapes from an open beaker, so [H2O(g)] stays low, Q = [H2O(g)] stays below K and net evaporation continues. A sealed bottle accumulates vapour until Q = K, so evaporation and condensation then occur at equal rates and the water level appears unchanged.
Collision theory and reaction rate
This recaps collision theory and activation energy from our Year 11 Module 3 notes.
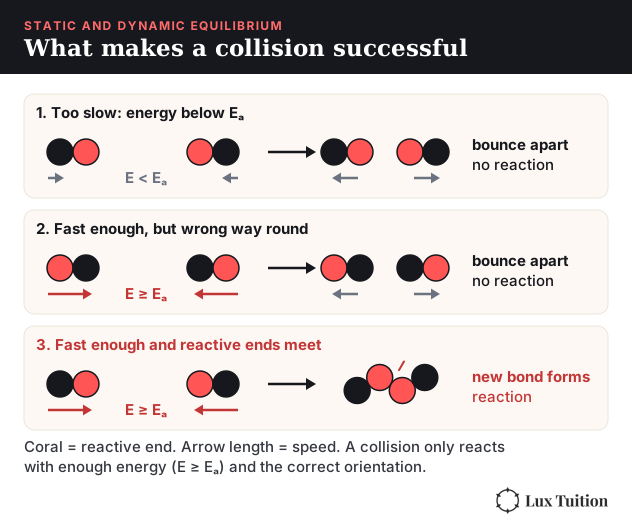
According to collision theory, for a reaction to occur, reactant particles must collide together. But not all collisions result in a reaction. There are two conditions which must be met: the particles must have enough energy, and they must have the correct orientation.
- More collisions. Increasing concentration puts more particles together. For a simple bimolecular reaction A + B → AB, the forward rate is given by the rate law rate = k[A][B], where k is the rate constant (fixed for a reaction at a given temperature) and square brackets mean concentration. Increasing temperature also makes particles bounce together more often.
- Enough energy. Without enough energy to overcome the activation energy, particles simply bounce off each other and don’t react. Increasing temperature increases the kinetic energy, so more collisions succeed. A catalyst provides an alternative pathway with a lower activation energy, so more collisions have enough energy.
- Correct orientation. If particles don’t hit each other in the right way, they won’t react.
Conclusion: increasing concentration and temperature, or using a catalyst, will increase the reaction rate.
What Factors Affect Equilibrium and How?
Equilibrium rates and equilibrium position
For the general reversible reaction A + B ⇌ AB, ratefor = kfor[A][B] and raterev = krev[AB]. When the reaction reaches equilibrium, ratefor = raterev, therefore kfor[A][B] = krev[AB].
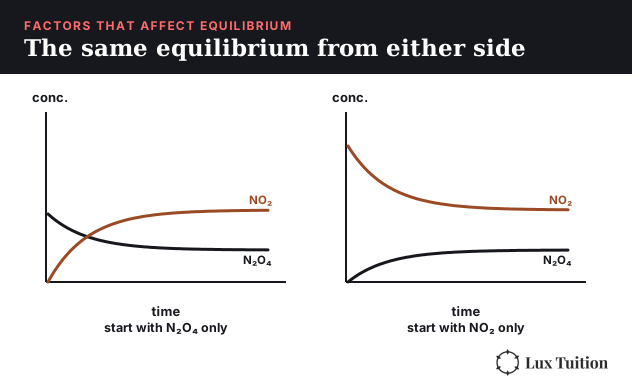
Because the forward reaction equals the reverse reaction, we observe no changes: this is called macroscopic constancy. The equilibrium can be reached from either direction, starting with only reactants or with only products. The equilibrium position is the particular set of concentrations in the system once it has reached equilibrium, when the forward reaction has become equal to the reverse reaction.
What is Le Chatelier’s principle?
“If a dynamic equilibrium is disturbed by changing the conditions, the position of equilibrium moves to counteract the change.”
In other words, when a chemical equilibrium is changed, the equilibrium will shift to oppose the change. The classic system is dinitrogen tetroxide (colourless) and nitrogen dioxide (brown), where the forward reaction is endothermic:
N2O4(g) ⇌ 2NO2(g) ΔH > 0
Temperature
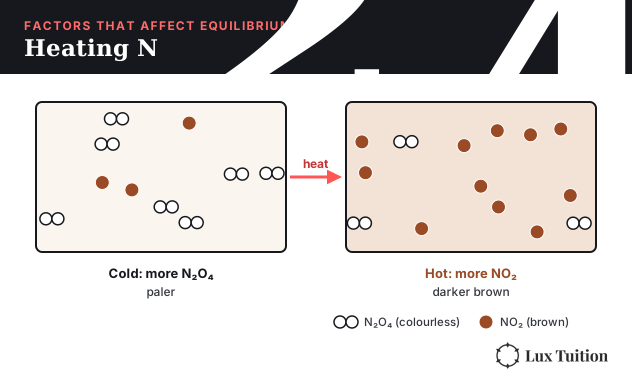
The forward reaction is endothermic (absorbs heat), therefore the reverse reaction must be exothermic (releases heat). If we increase the temperature, the system will move to counteract the change by moving in the direction that absorbs heat. That is the endothermic forward reaction, so the equilibrium position shifts to the right: more NO2(g) forms, observed as an increase in colour.
If we decrease the temperature, the system counteracts by releasing heat. The exothermic reverse reaction is favoured, shifting the equilibrium position to the left. More N2O4(g) forms, observed as a decrease in colour.
Example. Carbon dioxide dissolving in water gives soft drinks their fizziness, and it’s exothermic: CO2(g) ⇌ CO2(aq), ΔH < 0. What happens to a bottle of soft drink left out in the sun? According to Le Chatelier’s principle, the system will react to counteract the disturbance. As the temperature has increased, the system shifts towards the endothermic reverse reaction, leading to less dissolved gas in the drink. Therefore the drink will go flat.
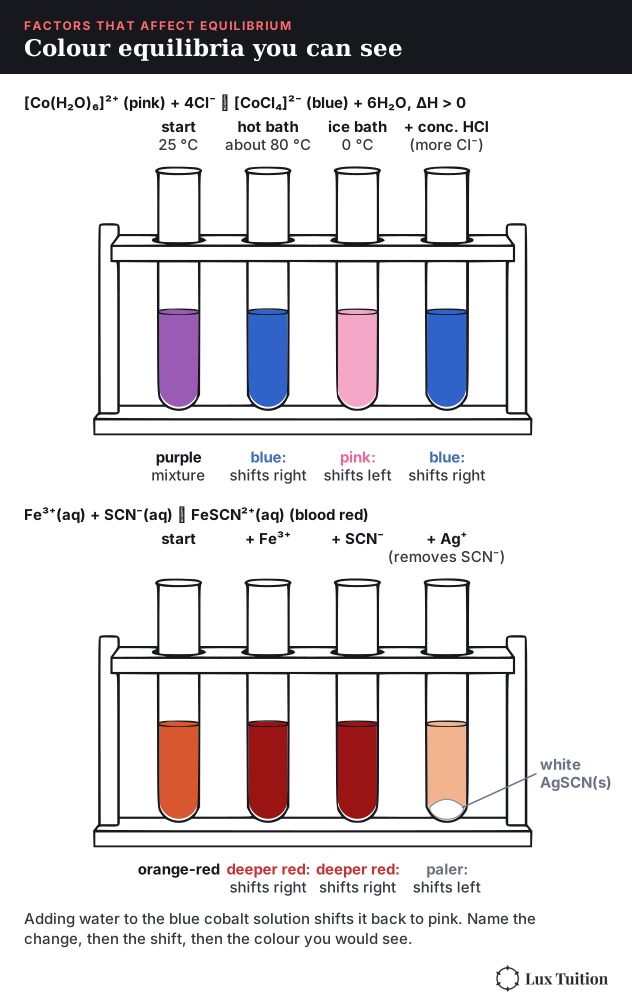
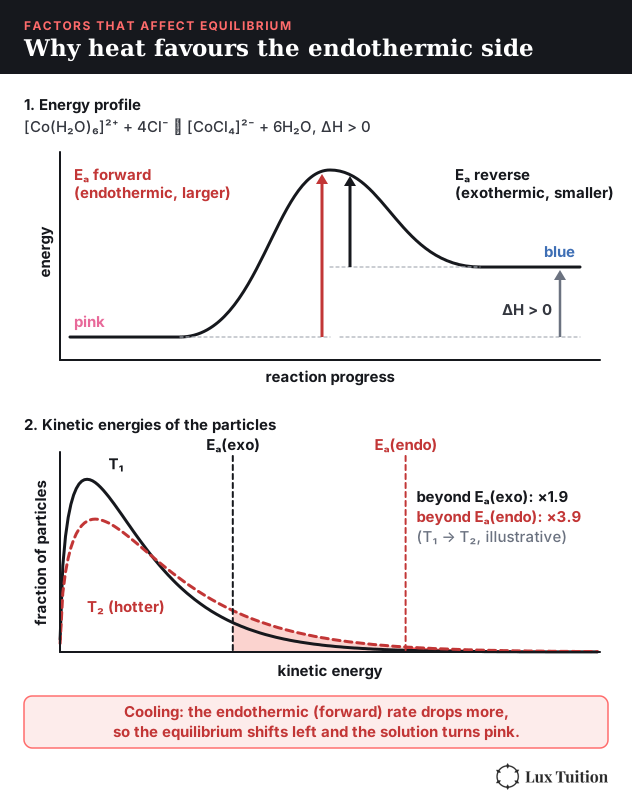
Heating cobalt(II) chloride. In solution, cobalt(II) exists as two coloured complex ions: [Co(H2O)6]2+(aq) (pink) + 4Cl−(aq) ⇌ [CoCl4]2−(aq) (blue) + 6H2O(l), ΔH > 0. Heating favours the endothermic forward reaction, so the solution turns blue. Cooling favours the exothermic reverse reaction, so it turns pink. Concentration works on the same system: adding Cl− (e.g. concentrated HCl) shifts it right to blue, and adding water shifts it left to pink.
Concentration
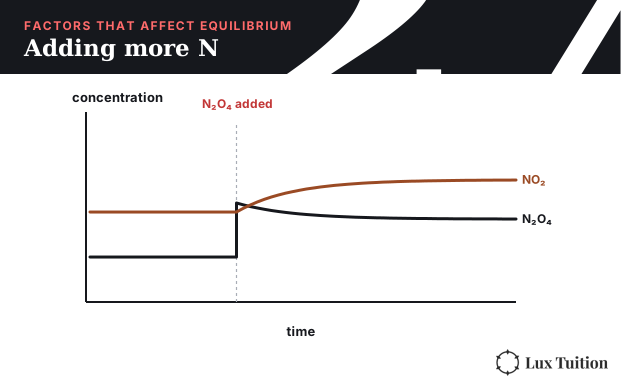
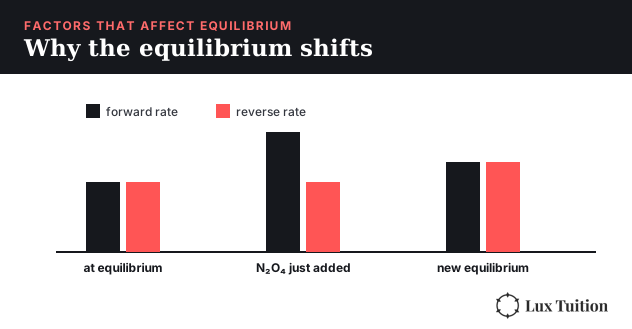
What if we inject more of our reactant, N2O4(g)? The forward reaction consumes reactant to make product, while the reverse reaction consumes product to make reactant. According to Le Chatelier’s principle, the system seeks to reduce the concentration of the added reactant by consuming it in the forward reaction, converting it to NO2. This will be observed as an increase in colour.
Iron(III) thiocyanate and varying concentration of ions. For Fe3+(aq) + SCN−(aq) ⇌ FeSCN2+(aq), adding either Fe3+ or SCN− shifts the equilibrium right, so the solution turns a deeper blood red. Removing either ion shifts it left, so the colour fades. Fe3+ can be removed by adding OH−, which precipitates it as Fe(OH)3, and SCN− can be removed by adding Ag+, which precipitates it as AgSCN.
Pressure and volume
Remember the ideal gas law, PV = nRT, from Year 11 Module 2: more moles of gas means more pressure. The forward reaction produces two moles of gas from one, increasing the pressure. The reverse reaction produces one mole of gas from two, decreasing the pressure. NO2 matters outside the lab too: it is the brown gas in photochemical smog, formed from car exhaust, and it irritates the lungs.
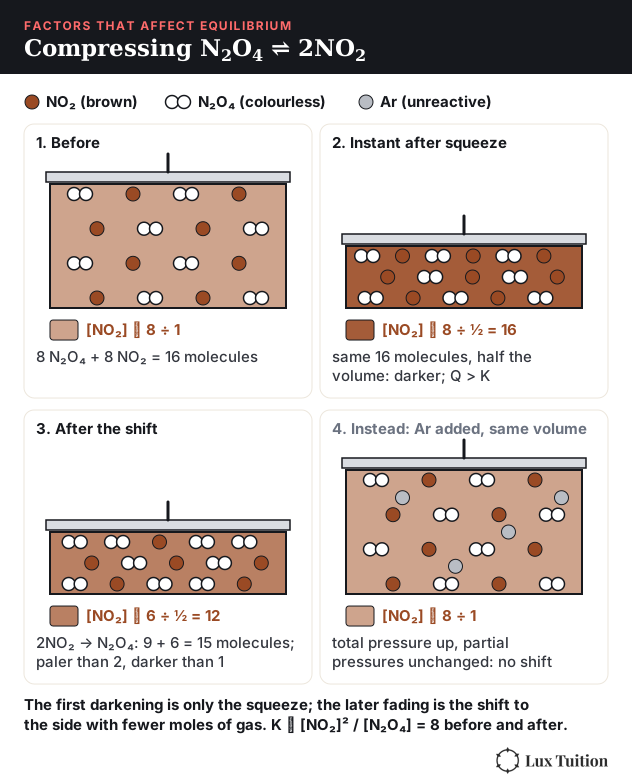
- Increase the pressure and the system counteracts by going in the reverse direction to decrease the pressure. N2O4(g) concentration increases as NO2 is used up. The colour changes in two stages: it darkens at first (the same amount of gas in a smaller space is more concentrated), then fades a little as the equilibrium shifts left, but stays darker than before the compression. The fading is the shift; the first darkening is only the squeeze.
- Increase the volume and the pressure decreases, so the equilibrium shifts to increase the pressure. That’s the forward reaction, which produces two moles of gas from one, so the system shifts right and more NO2 forms. The colour changes in two stages: it looks paler at first (the same amount of gas spread over a larger space), then darkens a little as the equilibrium shifts right, but stays paler than before the expansion. The darkening is the shift; the first paleness is only the spreading out.
- Add an inert gas at constant volume (e.g. argon) and the total pressure rises, but nothing shifts. The inert gas doesn’t react, and the concentration and the partial pressure (the pressure that one gas alone contributes) of each reacting gas are unchanged, so the equilibrium is not disturbed.
- Dilute an aqueous equilibrium with water and every dissolved species becomes less concentrated. The system counteracts by shifting towards the side with more dissolved particles. For Fe3+(aq) + SCN−(aq) ⇌ FeSCN2+(aq), that is the left, so the colour fades by more than dilution alone would cause.
Reading concentration–time graphs: the Haber process
The Haber process is an important industrial process for making ammonia for fertiliser:
3H2(g) + N2(g) ⇌ 2NH3(g) ΔH < 0
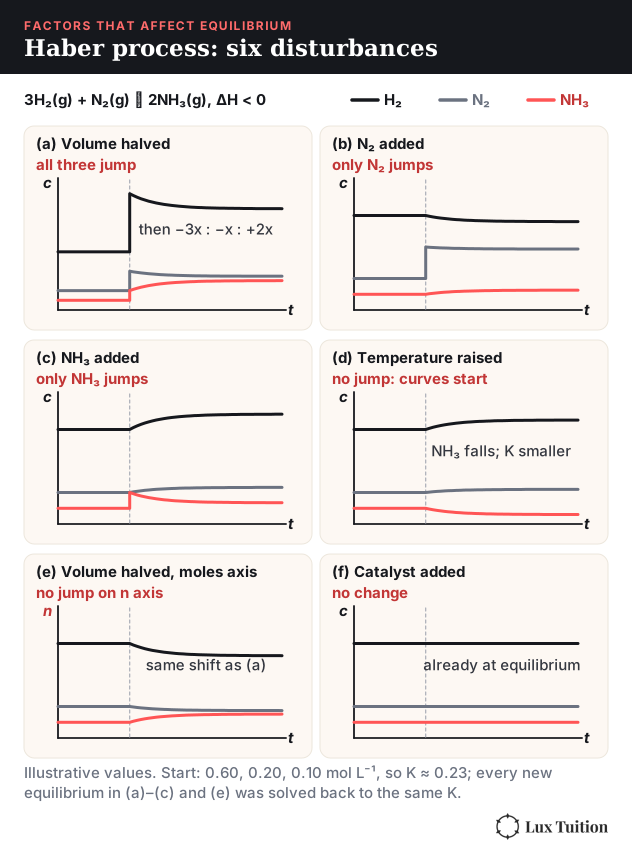
- Volume reduced at T2. A decrease in volume effectively increases the concentration of each species, so there is a sudden spike in every concentration. According to Le Chatelier’s principle, the reaction shifts to counteract the decrease in volume by favouring the side with fewer moles of gas. As this is the forward reaction, the reactants gradually decrease and the product gradually increases until a new equilibrium position is formed, shown by flat lines on the graph.
- Nitrogen added at T2. Initially the equilibrium is disturbed by a spike in the nitrogen concentration only. The equilibrium shifts to counteract the change by using up reactants in the forward reaction. N2 and H2 gradually decrease and NH3 gradually increases, eventually flattening out as a new equilibrium is reached.
- Ammonia added at T2. This time only the ammonia line spikes. The equilibrium shifts to use up products via the reverse reaction, so N2 and H2 gradually increase and NH3 gradually decreases until a new equilibrium is reached.
Notice that the changes in concentration after the spike follow the mole ratio of the equation: H2 changes three times as much as N2, and NH3 changes twice as much as N2. Module 5 Figure 18 shows all six disturbances side by side.
A temperature change looks different on a concentration–time graph. Heating or cooling doesn’t add or remove any substance, so there is no vertical jump in any line. Instead, the concentrations start changing gradually as curves from the moment of the change. For the exothermic Haber process, heating makes N2 and H2 curve up and NH3 curve down. A vertical jump always means a concentration or volume change, never a temperature change.
Check the y-axis before you decide. On a concentration–time graph, a volume change makes every concentration jump instantly. On an amount (moles)–time graph, a volume change does not change the number of moles at that instant, so there is no jump: the lines only start to curve as the equilibrium shifts. That means a volume change and a temperature change both show smooth curves with no jump on an amount–time graph. A full-mark answer states both disturbances (for example, a volume decrease and a temperature change) and links each to the shift it causes.
How does collision theory explain Le Chatelier’s principle?
Le Chatelier’s principle helps us predict what happens when an equilibrium is disturbed, but it doesn’t explain why. Collision theory does.
- Concentration. If we increase the concentration of a reactant, there are more reactant particles and so more collisions between them. This increases the rate of the forward reaction, which produces more product: exactly what Le Chatelier’s principle predicts!
- Volume and pressure. Increasing the volume (equivalent to decreasing the pressure) reduces the rate of both reactions, as particles collide less. But it reduces the rate of the direction with more moles of gas reacting much more than the other. So the direction that produces the most moles of gas is favoured. For N2O4 ⇌ 2NO2, the reverse reaction needs two NO2 particles to collide, so it slows the most, and more NO2 is produced.
- Temperature. Raising the temperature increases the rate of both reactions, but it increases the rate of the endothermic reaction more than the exothermic one, because the endothermic direction has the higher activation energy. Here the forward reaction is endothermic, so heating favours it and we observe more NO2 and more colour.
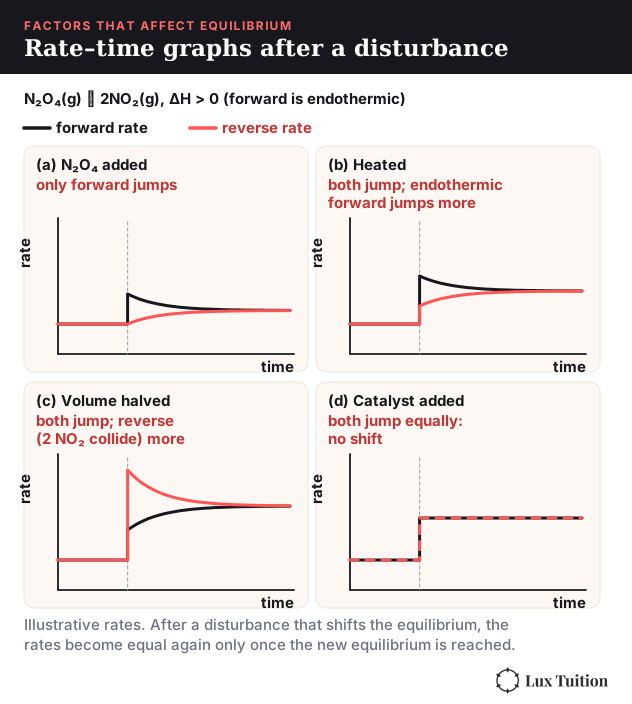
Rate–time graphs. A rate–time graph plots the forward and reverse rates, which are equal at equilibrium. After a disturbance they separate, the favoured direction runs faster, and they only become equal again once the new equilibrium is reached:
- Concentration change. Adding a reactant makes the forward rate jump straight up while the reverse rate is unchanged at that instant. The forward rate then falls as reactant is used up, and the reverse rate rises gradually as product builds up, until they meet. Removing a product instead makes the reverse rate drop suddenly.
- Temperature change. Heating makes both rates jump at once, but the endothermic direction jumps more. Its rate then falls and the other rises until they are equal. Cooling makes both drop, the endothermic one by more.
- Volume or pressure change. Halving the volume raises every gas concentration at once, so both rates jump, and the direction with more moles of gas reacting jumps more. Increasing the volume makes both drop, that same direction by more.
- Catalyst. Both rates jump up by the same amount and stay equal, so there is no shift. A catalyst only helps a system that is not yet at equilibrium reach it sooner.
Does a catalyst change the equilibrium position?
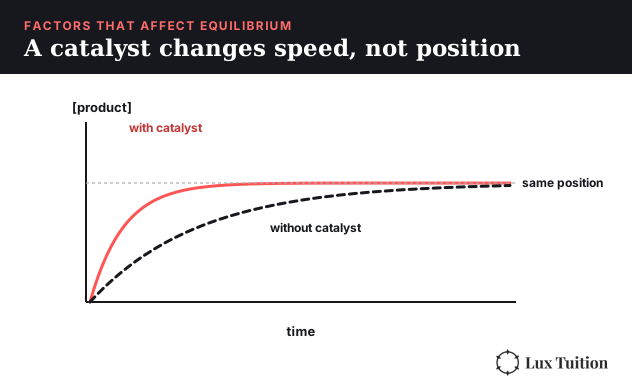
A catalyst speeds up both the forward and reverse reactions equally. Adding a catalyst allows the reaction to reach equilibrium faster, but it will not affect the equilibrium position. Because a catalyst effectively decreases the activation energy, the same logic applies to activation energy in general: it affects how fast equilibrium is reached, not where it ends up. A higher activation energy means equilibrium will be reached more slowly.
The heat of reaction (the enthalpy change for the reaction) does affect the equilibrium. A more exothermic reaction will tend to have an equilibrium position that favours the products more, and a more endothermic reaction will tend to have an equilibrium position that favours the reactants more. This only holds when the entropy changes are similar. What really decides the position is ΔG = ΔH − TΔS, not ΔH alone: a reaction with a favourable (positive) ΔS can favour products even if it is endothermic.
How Can the Position of Equilibrium Be Described and What Does the Equilibrium Constant Represent?
What is the equilibrium constant?
For a single-step reaction A + B ⇌ AB, the forward rate is kf[A][B] and the reverse rate is kr[AB], where kf and kr are rate constants: numbers, fixed for each reaction at a given temperature, that link its rate to the concentrations. At equilibrium the two rates are equal, so rearranging kf[A][B] = kr[AB] gives the equilibrium constant, Keq = kf / kr = [AB] / ([A][B]). Because it is written with concentrations, it is also called Kc: Kc and Keq mean the same thing in HSC Chemistry.
For a general reaction aA + bB ⇌ cC + dD, the equilibrium expression is:
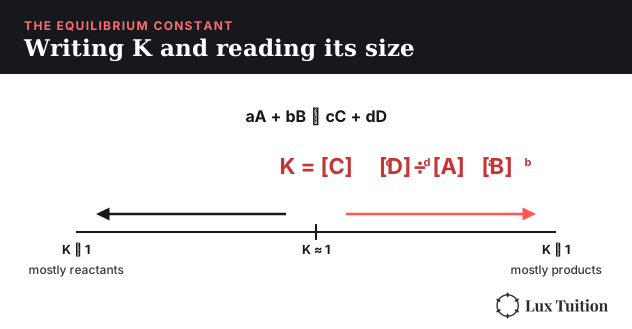
Keq = [C]c[D]d / ([A]a[B]b)
Products go on top, reactants on the bottom, and each concentration is raised to the power of its coefficient. The concentrations of solids, pure liquids and solvents are effectively constant, so we leave them out of the expression. Once we know K for a reaction, we can calculate equilibrium concentrations if we are given enough information.
- K > 1 means the reaction favours the products.
- K < 1 means the reaction favours the reactants.
- The closer to 0 that K gets, the lower the equilibrium concentration of products.
- A very large K (say 1010) means the reaction effectively goes to completion. You can assume the limiting reactant is used up, then use K to back-calculate the tiny trace of it left over.
- A very small K (say 10−10) means almost no reaction happens: the mixture is still almost all reactants.
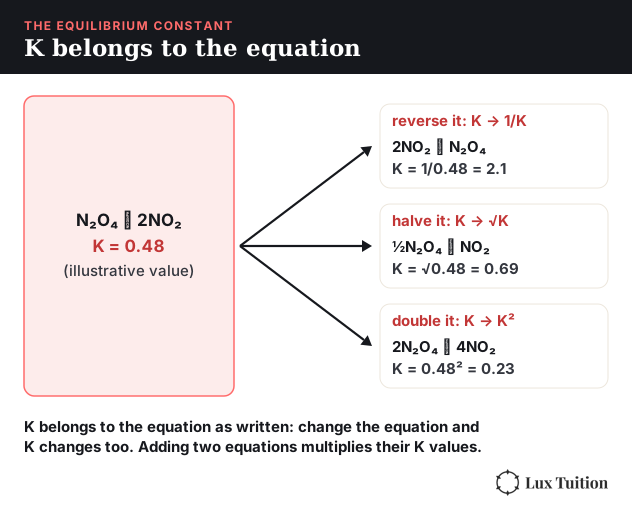
Manipulating K. A K value only has meaning alongside the equation it was written for, because changing the equation changes the expression:
- Reversing the equation swaps products and reactants, so the new K is 1/K.
- Multiplying every coefficient by n raises each concentration to n times the power, so the new K is Kn. Doubling the coefficients gives K2, and halving them gives √K.
- Adding two equations to get an overall equation multiplies their K values: Koverall = K1 × K2.
How does temperature affect K?
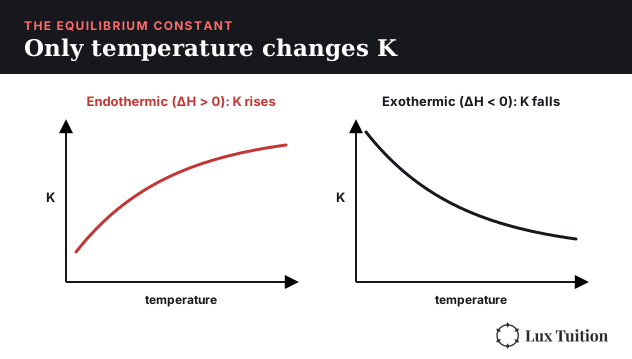
Temperature is the only factor that changes the equilibrium constant. Concentration, pressure and volume changes move the equilibrium position, but the system shifts until the ratio returns to the same K.
Consider N2O4(g) ⇌ 2NO2(g), ΔH > 0. According to Le Chatelier’s principle, our products will increase if temperature is increased. This occurs through the forward reaction converting reactants to products, so the ratio of products to reactants increases.
- For an endothermic reaction, K increases with an increase in temperature and decreases with a decrease in temperature.
- For an exothermic reaction, the opposite occurs: increasing the temperature leads to a decrease in K.
With equilibrium constants, we always consider what happens to the ratio of products to reactants.
How to calculate the equilibrium constant
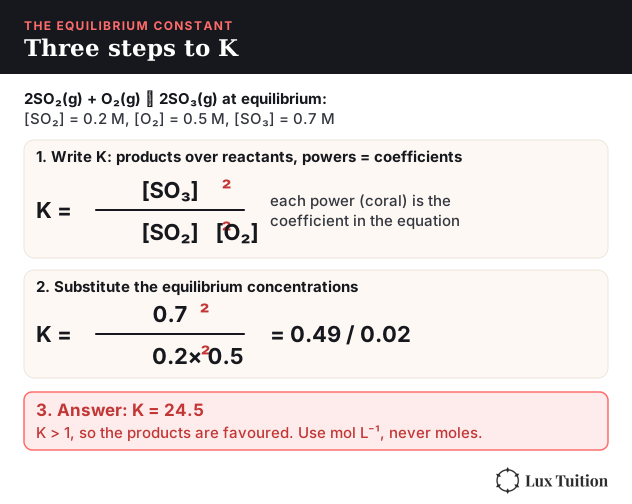
Finding K from equilibrium concentrations. 2SO2(g) + O2(g) ⇌ 2SO3(g) is the key step of the Contact process, which makes sulfuric acid industrially. At equilibrium [SO2] = 0.2 M, [O2] = 0.5 M and [SO3] = 0.7 M.
Keq = [SO3]2 / ([SO2]2[O2]) = 0.72 / (0.22 × 0.5) = 0.49 / 0.02 = 24.5
Finding a concentration from K. Suppose Kc for N2O4(g) ⇌ 2NO2(g) is 0.48 at a particular temperature (an illustrative value). What is [NO2] in equilibrium with 0.36 M N2O4?
[NO2]2 = K × [N2O4] = 0.48 × 0.36 = 0.1728, so [NO2] = √0.1728 = 0.42 M
If you’re given moles and a vessel volume instead (say 4 mol of N2O4 in a 10 L vessel), use c = n/V first to get 0.4 M, then do the same calculation.
How to use an ICE table
Harder questions give you starting amounts and one equilibrium amount, so you need to work out the change in concentration first. An ICE table (Initial, Change, Equilibrium) keeps it organised.
Example. PCl3(g) + Cl2(g) ⇌ PCl5(g). 4.0 mol of PCl3 and 3.0 mol of Cl2 are pumped into a 1 L vessel. At equilibrium there is 0.75 mol of PCl5. Calculate Kc.
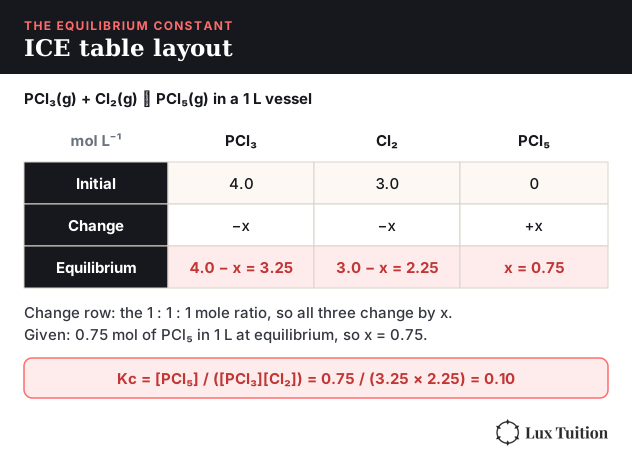
Kc = [PCl5] / ([PCl3][Cl2]) = 0.75 / (3.25 × 2.25) = 0.10
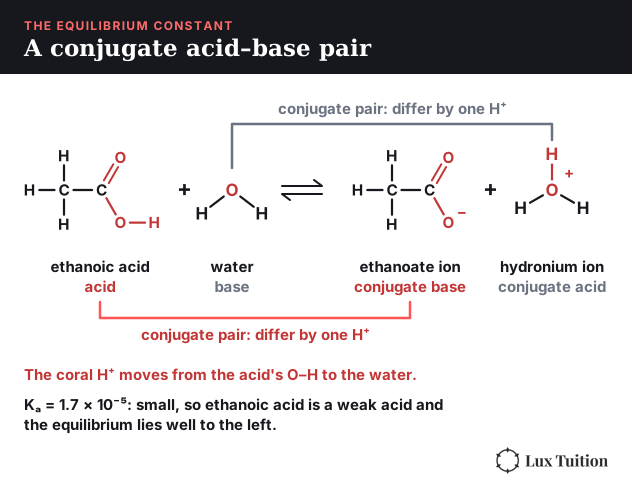
Other questions give you K and ask for the final equilibrium concentration, which may need the quadratic formula. Acetic acid is a weak acid: only a small fraction of its molecules ionise in water. The equilibrium constant for an acid ionising is called the acid dissociation constant, Ka. Writing acetic (ethanoic) acid as HA, HA(aq) + H2O(l) ⇌ A−(aq) + H3O+(aq), Ka = 1.7 × 10⁻⁵. (Its full structure, and the proton it loses, are drawn in Module 5 Figure 32.) Starting from 1 M acid, the ICE table gives x2 / (1 − x) = 1.7 × 10⁻⁵. Solving the quadratic, [H3O+] = x = 4.1 × 10⁻³ M. (Module 6 shows the shortcut for weak acids like this one.)
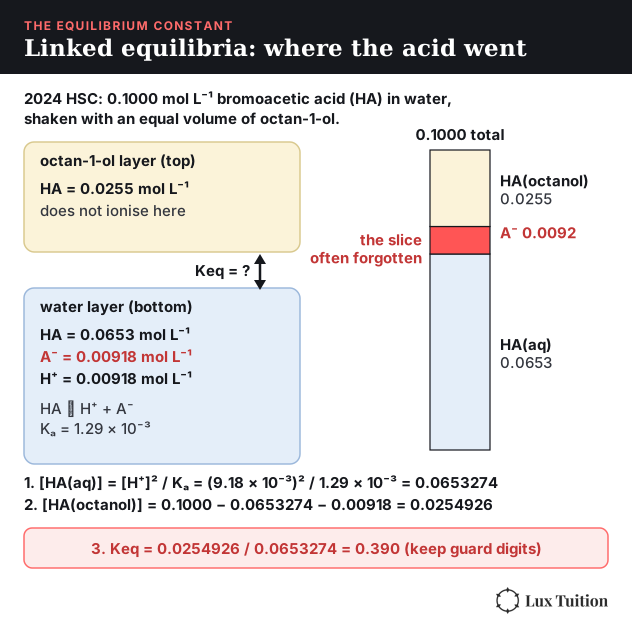
Linked equilibria: an acid shared between two solvents. Sometimes one substance sits in two equilibria at once, so you must account for every form it can take. In the 2024 HSC, an aqueous solution of bromoacetic acid (written HA, molecular formula C2H3BrO2, initial concentration 0.1000 mol L−1) was shaken with an equal volume of octan-1-ol, which does not mix with water. The acid dissolves in both layers, and in water it also ionises (Ka = 1.29 × 10⁻³). At equilibrium [H+] = 9.18 × 10⁻³ mol L−1. Because the acid does not ionise in octan-1-ol, the starting amount splits three ways:
initial = [HA(aq)] + [A−(aq)] + [HA(octan-1-ol)]
- Use Ka to find the un-ionised acid left in water. Each ionised acid gives one H+ and one A−, so [A−] = [H+] and [HA(aq)] = [H+][A−] / Ka = (9.18 × 10⁻³)2 / 1.29 × 10−3 = 0.0653274, which is 0.0653 mol L−1 to 3 significant figures. Keep the extra digits in your calculator for the next step.
- Subtract everything accounted for from the starting amount: [HA(octan-1-ol)] = 0.1000 − 0.0653274 − 0.00918 = 0.0254926 mol L−1.
- Write Keq for the transfer between the layers: Keq = [HA(octan-1-ol)] / [HA(aq)] = 0.0254926 / 0.0653274 = 0.390. Rounding the two concentrations before dividing can shift the last digit, so keep guard digits until the end.
The common mistake is forgetting the ionised form (A−) in step 2, which gives a wrong octan-1-ol concentration.
Weak bases and Kb. A weak base takes a proton from water, the reverse of what an acid does: B(aq) + H2O(l) ⇌ BH+(aq) + OH−(aq). Its equilibrium constant is the base dissociation constant, Kb = [BH+][OH−] / [B] (water is left out, as for Ka). With starting concentration c and x mol L−1 reacting, the ICE table gives Kb = x2 / (c − x), and when x is tiny compared with c, Kb ≈ x2 / c. In the 2020 HSC, propan-2-amine (a weak base, molecular formula C3H9N, with the –NH2 group on the middle carbon, starting at 1.00 mol L−1, Kb = 4.37 × 10⁻⁴) gave [OH−] = x. Solving x2 / (1.00 − x) = 4.37 × 10⁻⁴ exactly gives x = 0.0207 mol L−1, and the small-x approximation √(4.37 × 10−4 × 1.00) gives 0.0209 mol L−1. Both are close because x is small compared with 1.00. Module 6 takes this further into pH.
How to find K using colourimetry
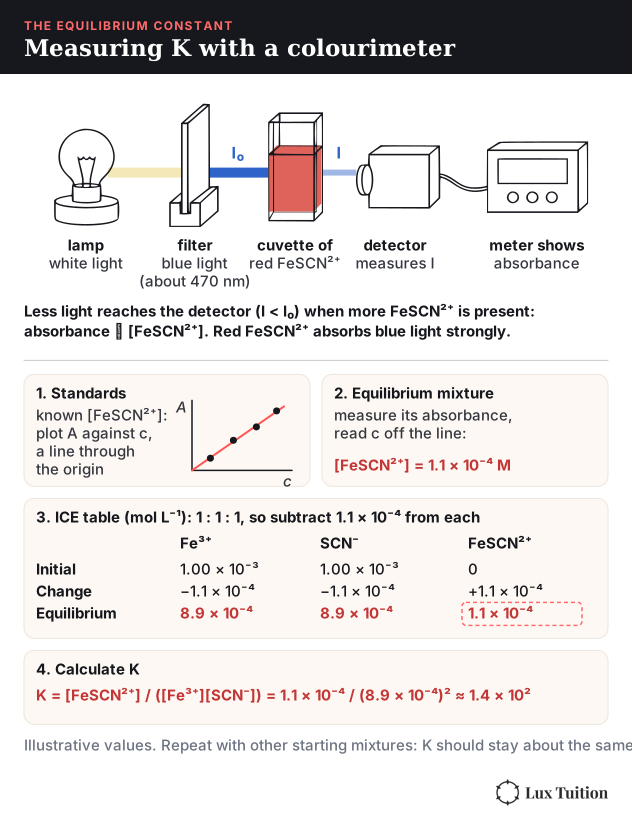
For Fe3+(aq) + SCN−(aq) ⇌ FeSCN2+(aq), only FeSCN2+ is strongly coloured, and that is the key to measuring K. A colourimeter shines light of a chosen colour through the solution and measures how much is absorbed, called the absorbance. The absorbance of a coloured species is directly proportional to its concentration, so a colourimeter can measure how much FeSCN2+ is present without disturbing the equilibrium. The same technique is covered in our Module 8 colourimetry notes.
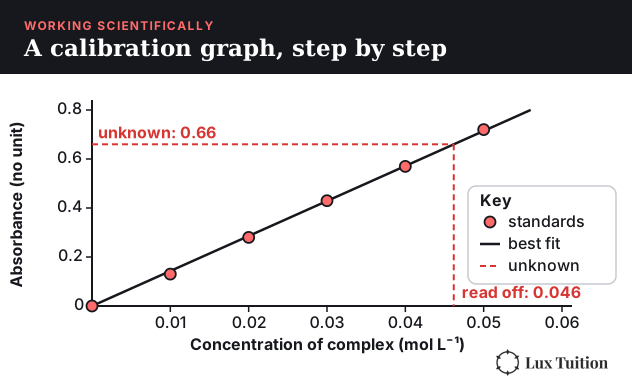
- Make a calibration curve. Prepare standards of known [FeSCN2+] (using a large excess of Fe3+ so practically all the SCN− is converted), measure their absorbances, and plot absorbance against concentration. It should be a straight line through the origin (Module 5 Figure 48 shows one).
- Measure the equilibrium mixtures. Mix known starting concentrations of Fe3+ and SCN−, let them reach equilibrium, measure the absorbance, and read [FeSCN2+] off the calibration curve.
- Find the other concentrations. The reaction is 1 : 1 : 1, so every mole of FeSCN2+ formed used up one mole of Fe3+ and one mole of SCN−. Subtract [FeSCN2+] from each starting concentration (an ICE table does this neatly).
- Calculate K. Substitute all three equilibrium concentrations into K = [FeSCN2+] / ([Fe3+][SCN−]).
Repeat this with different starting concentrations at the same temperature. The equilibrium concentrations will differ from trial to trial, but K should come out roughly constant, which is good evidence that K depends only on temperature.
What is the reaction quotient (Q)?
The reaction quotient Q is the ratio of products to reactants at any point in the reaction. Q is calculated with the same expression as K, but it may not be the same value: K only uses concentrations at equilibrium, while Q uses the concentrations at a certain moment. Q tells us whether a reaction is at equilibrium, and if it isn’t, which way it will shift to get there.
- If Q = K, the reaction is at equilibrium.
- If Q < K, the reaction will shift towards the products to reach equilibrium.
- If Q > K, the reaction will shift towards the reactants to reach equilibrium.
This is why a positive ΔG° does not stop a reaction in every situation: evaporation can proceed into unsaturated air because Q is below K, while in a sealed bottle Q rises until it equals K.
Example. For PCl3(g) + Cl2(g) ⇌ PCl5(g), Kc = 0.1. A 2 L vessel contains 4.0 mol PCl3, 3.0 mol Cl2 and 1.5 mol PCl5. The concentrations are 2.0 M, 1.5 M and 0.75 M, so Q = 0.75 / (2.0 × 1.5) = 0.25. Since Q > K, the reaction is not at equilibrium and will shift to the left, towards the reactants.
K for ionic solutions and acids
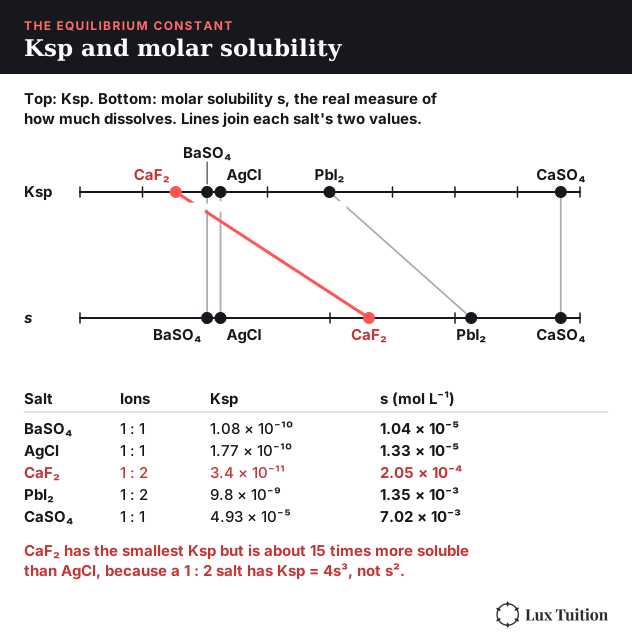
Recap: K is the ratio of products to reactants. For a dissolution reaction, the product is the aqueous ions. The K for a salt dissolving is called the solubility product, Ksp, covered in full in the solubility section below. Compare BaBr2 (barium bromide, so soluble that its Ksp isn’t usually tabulated) with BaSO4 (barium sulfate, Ksp = 1.08 × 10⁻¹⁰). BaBr2 has a far higher Ksp, meaning there are a lot more aqueous ions in solution: it is soluble. BaSO4 has a much lower Ksp, meaning there are barely any aqueous ions in solution: it is insoluble.
Acids work the same way. When an acid dissociates, it loses a proton to form its conjugate base. Here a proton means a hydrogen ion, H+, which is just a hydrogen atom without its electron. When acetic (ethanoic) acid gives a proton to water, it forms the acetate (ethanoate) ion and the hydronium ion, H3O+, as drawn in Module 5 Figure 32. Acetate is the conjugate base of acetic acid, and acetic acid is the conjugate acid of acetate. A conjugate base has one less proton than its conjugate acid. The K for this reaction is the acid dissociation constant, Ka, from the ICE table section: a small Ka means a weak acid. Module 6 picks this up in detail.
Two more rules help with acid–base equilibria. A stronger acid has a weaker conjugate base (and a stronger base has a weaker conjugate acid). And proton transfer favours the weaker acid and the weaker base: in HA + B ⇌ A− + BH+, the equilibrium lies towards the side holding the weaker acid and weaker base, so if HA is a stronger acid than BH+, the position favours the products.
How Does Solubility Relate to Chemical Equilibrium?
How do ionic compounds dissolve in water?
Our Year 11 Module 4 notes cover the energy changes in dissolving ionic substances.
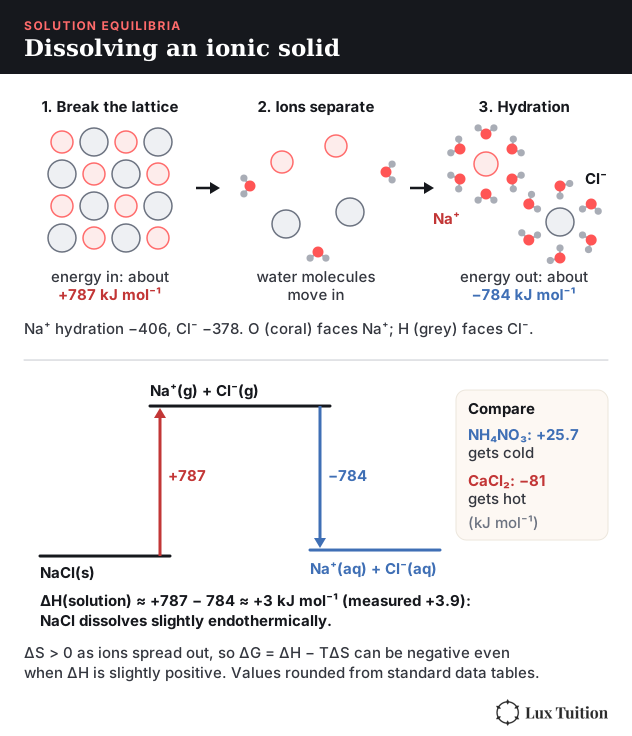
Ionic compounds in their solid state are composed of anions and cations held together by electrostatic attraction in a crystal lattice: ionic bonds. Energy is released when the lattice is formed, called the lattice energy, so the same amount must be supplied to pull the lattice apart.
Water is a polar molecule: oxygen is more electronegative than hydrogen, so electrons spend more time around the oxygen, giving it a slight negative charge. This is called a dipole. In liquid water, the slightly positive hydrogens are attracted to the slightly negative oxygens of neighbouring molecules and form hydrogen bonds. These are weaker than covalent bonds but still significant.
Three different interactions are involved in dissolution:
- Solvent–solvent, e.g. water with water.
- Solute–solute, e.g. Na+ with Cl−.
- Solute–solvent, e.g. Na+ with H2O.
For a salt to dissolve, the salt particles need to interact strongly enough with water molecules to make up for breaking the attractions between the salt particles themselves and between the water molecules. As this happens, solute particles become surrounded by solvent molecules. When an ion is surrounded by water dipoles it’s an ion–dipole interaction, and the process is called hydration. Hydrating an ion releases energy, the hydration energy. Dissolving is energetically favourable when the hydration energy released is at least as large as the energy needed to break the lattice and the hydrogen bonds between water molecules. Where it is slightly smaller, dissolving can still be spontaneous because of the entropy gained when ions spread out into solution.
This is the Gibbs free energy recap applied to dissolving, ΔG = ΔH − TΔS:
- ΔH is the energy needed to break the lattice (and some water–water hydrogen bonds) minus the hydration energy released. If hydration releases more, ΔH is negative and dissolving is exothermic. If breaking the lattice costs more, ΔH is positive and the solution gets colder, as when ammonium nitrate dissolves.
- ΔS is usually positive, because ions locked in an ordered lattice spread out through the solution.
- ΔG decides it. A negative ΔH and positive ΔS always give a negative ΔG, so the salt dissolves. A positive ΔH can still be outweighed by a large enough TΔS, which is why endothermic dissolving is often helped by warming. When ΔH is so positive that TΔS can’t make up for it, ΔG stays positive and the salt is insoluble.
How did Aboriginal peoples remove toxins from cycad seeds?
This builds on the cycad detox section of our Year 11 Module 3 notes.
Macrozamia is a genus of cycads found in Australia, and its seeds have traditionally been eaten by Aboriginal people. When European explorers ate the seeds without preparing them, they were poisoned by toxins such as macrozamin (related to cycasin, the toxin in Cycas cycads), which caused vomiting and severe illness.
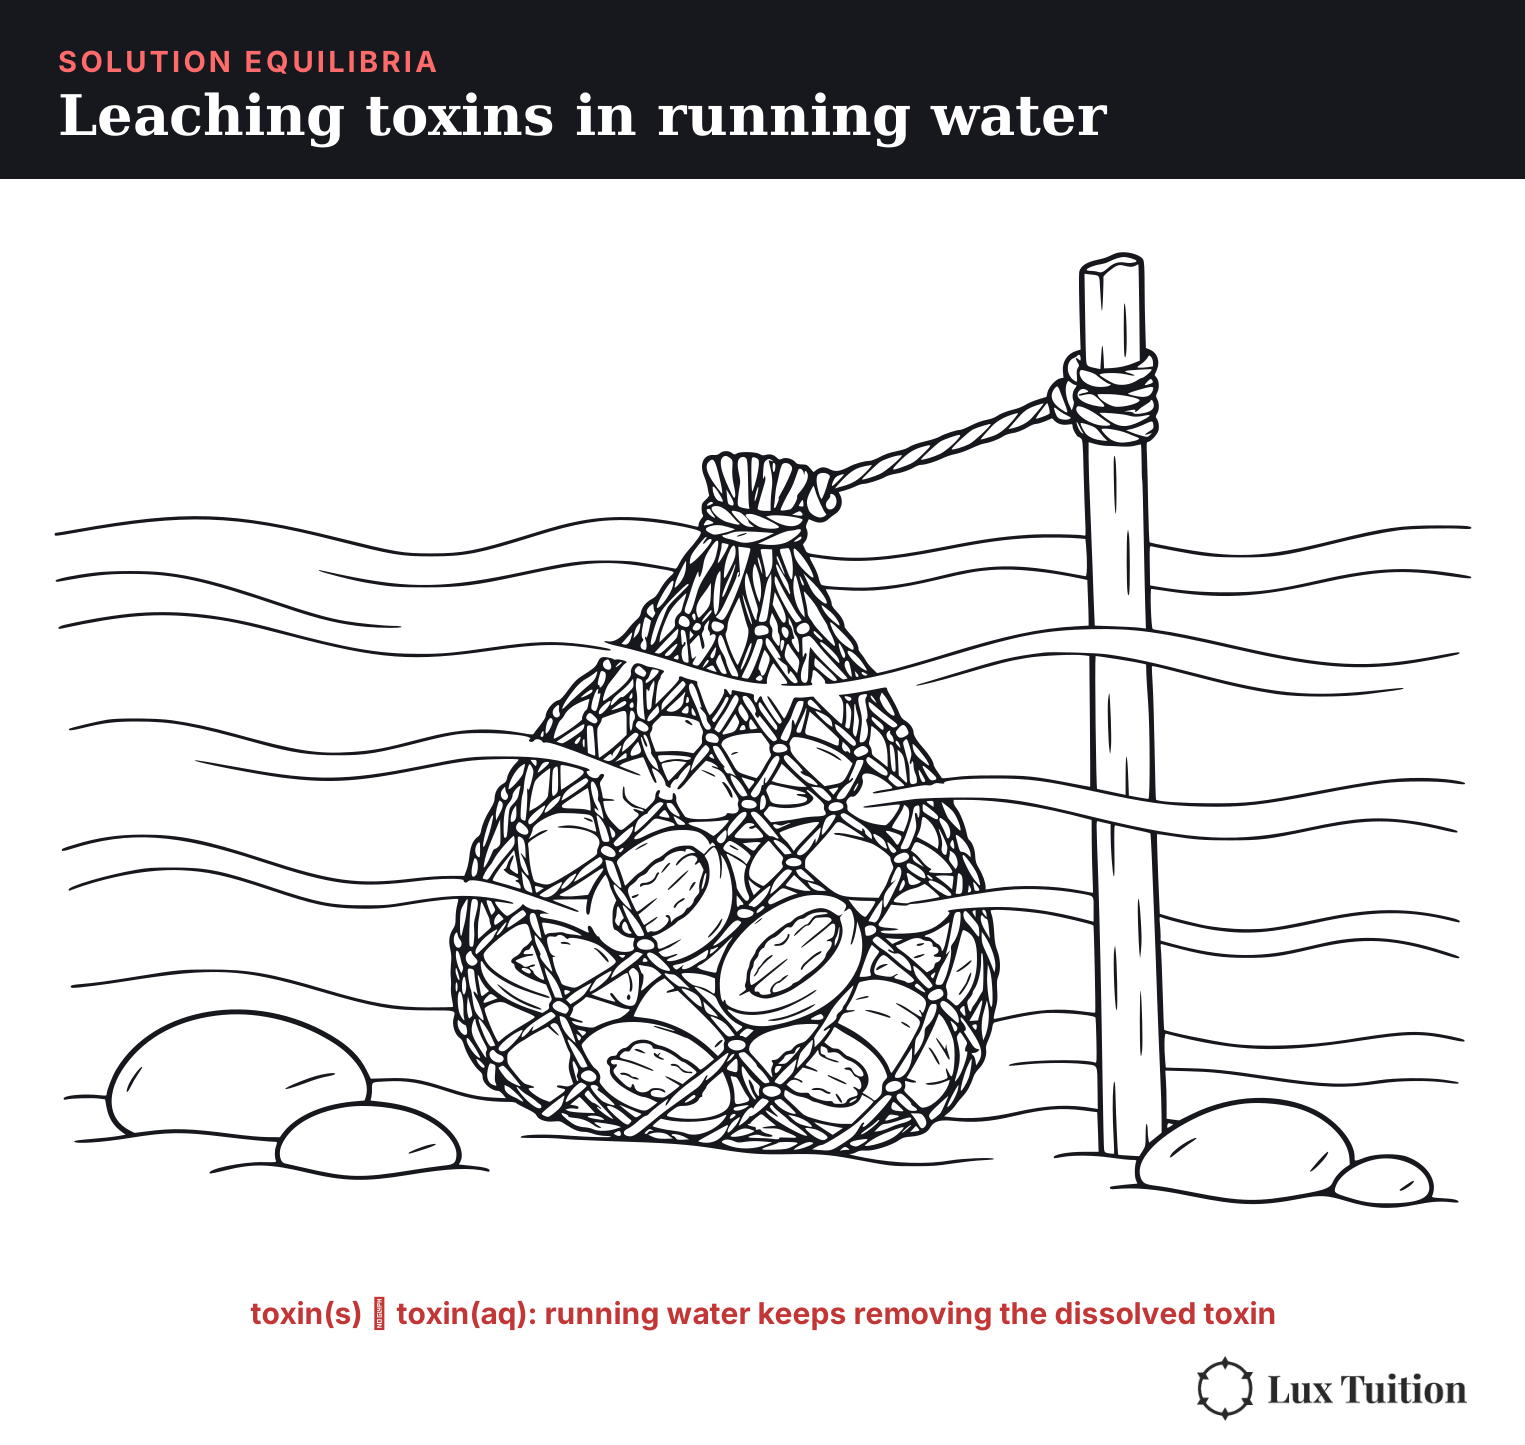
These toxins are water soluble: toxin(s) ⇌ toxin(aq). One method Aboriginal people used to make the seeds safe was to cut them open, then soak them in running water for days to leach out the toxins. This created an open system where the dissolved toxin was continuously removed, pushing the equilibrium to the right according to Le Chatelier’s principle. Eventually the seeds were safe to eat, and were then pounded into flour and baked.
The same leaching principle appears in other traditional food preparation. The Tiwi people of the Northern Territory prepare a bitter yam for the Kulama ceremony by cooking it and soaking it in running water to remove its water-soluble toxins.
Solubility rules (SNAAP)
These are the same solubility rules from Year 11 Module 3.
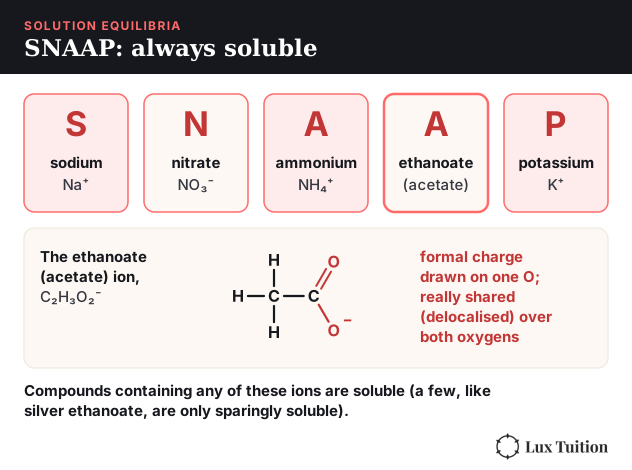
If a compound contains any of these species, it will be soluble (with a few rare exceptions, like sparingly soluble silver acetate). Remember SNAAP:
- Sodium (Na+), Nitrates (NO3−), Ammonium (NH4+), Acetate (ethanoate, C2H3O2−, drawn in Module 5 Figure 36), Potassium (K+)
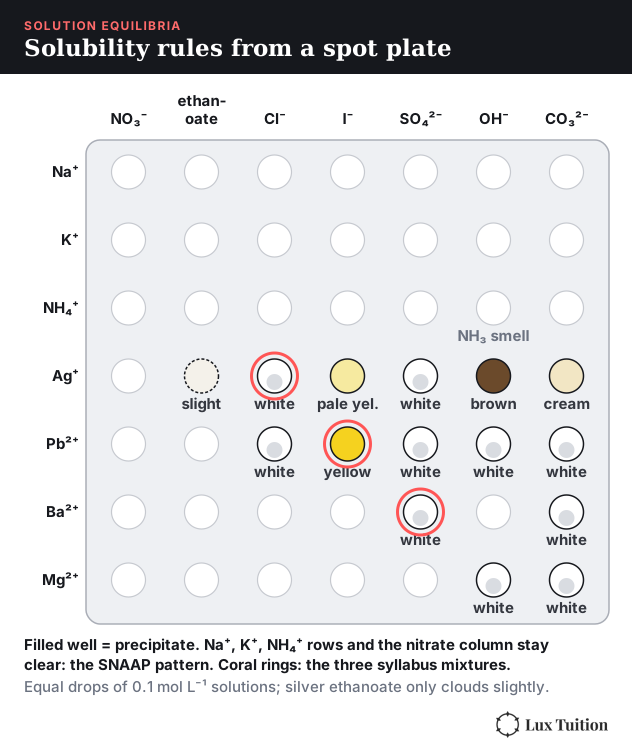
If the compound has any of these species (and none of the SNAAP ions), it will probably be insoluble: lead (Pb2+), barium (Ba2+) with sulfate or carbonate, silver (Ag+), mercury (Hg2+), carbonate (CO32−), phosphate (PO43−) and hydroxide (OH−). Check the Ksp values on the HSC data sheet if in doubt.
Investigating the rules. The syllabus investigation is a grid. On a spot plate (a tray with small wells), mix a few drops of each cation solution with a few drops of each anion solution, one pair per well. Record “precipitate” or “no precipitate” in a table with cations down the side and anions across the top. The pattern appears quickly: pairs containing Na+, K+, NH4+ or NO3− stay clear, and acetate pairs usually do (silver acetate can cloud at higher concentrations). Let the observations, at the concentrations you tested, suggest the SNAAP rules rather than assuming them.
Mixing ionic solutions
Precipitation reactions and net ionic equations are introduced in our Year 11 Module 3 notes.
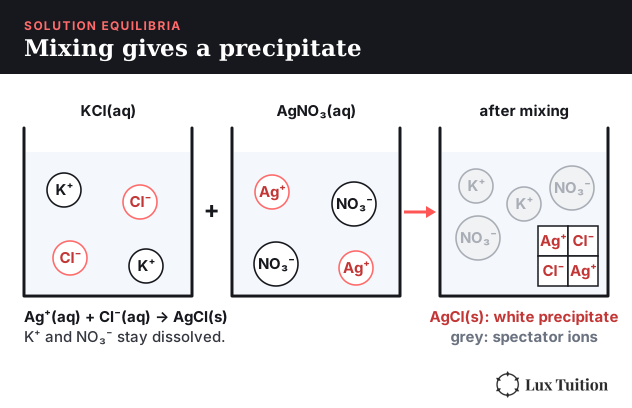
Mixing two soluble salts may result in the precipitation of a new insoluble salt: something dissolved in solution becoming an insoluble solid. Precipitation tests can also identify unknown ions: add reagents one after another, each to a fresh sample, and note which gives a precipitate. For example, Ag+(aq) + Cl−(aq) → AgCl(s) (white) identifies chloride (2020 HSC Q22 used this). The full sequence there identified a cation by flame test (Ba2+ pale green, Ca2+ brick red, Mg2+ no colour; more in Module 8), then the anion on fresh samples: Cu(NO3)2(aq) gives a pale blue precipitate if OH− is present; AgNO3(aq) gives a white precipitate if Cl− is present; if neither precipitate forms, the ethanoate (acetate) ion is what is left. The reaction only happens if a precipitate forms. For these mixtures, no precipitate means no precipitation reaction, e.g. KCl(aq) + NaNO3(aq) gives no precipitate. The three syllabus mixtures:
- KCl(aq) + AgNO3(aq) → AgCl(s) + KNO3(aq). Ksp(AgCl) = 1.77 × 10⁻¹⁰
- 2KI(aq) + Pb(NO3)2(aq) → 2KNO3(aq) + PbI2(s). Ksp(PbI2) = 9.8 × 10⁻⁹
- Na2SO4(aq) + Ba(NO3)2(aq) → 2NaNO3(aq) + BaSO4(s). Ksp(BaSO4) = 1.08 × 10⁻¹⁰
What is Ksp (the solubility product)?
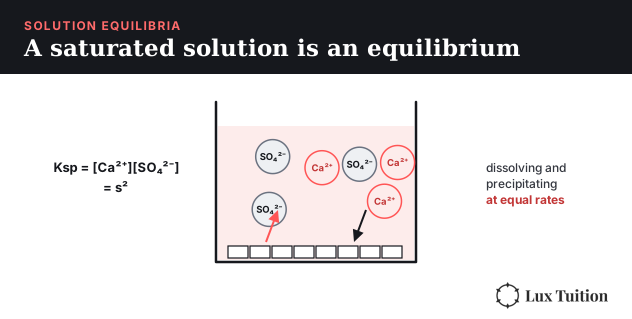
A saturated solution of an ionic salt is an equilibrium between the solid and its aqueous ions. Its equilibrium constant is the solubility product, Ksp. The solid is left out of the expression:
- AgCl(s) ⇌ Ag+(aq) + Cl−(aq) Ksp = [Ag+][Cl−]
- CaF2(s) ⇌ Ca2+(aq) + 2F−(aq) Ksp = [Ca2+][F−]2
Molar solubility is the number of moles of salt that will dissolve per litre of saturated solution (units: mol L−1). Ksp can be used to calculate molar solubility, and molar solubility can be used to calculate Ksp. Call the molar solubility s.
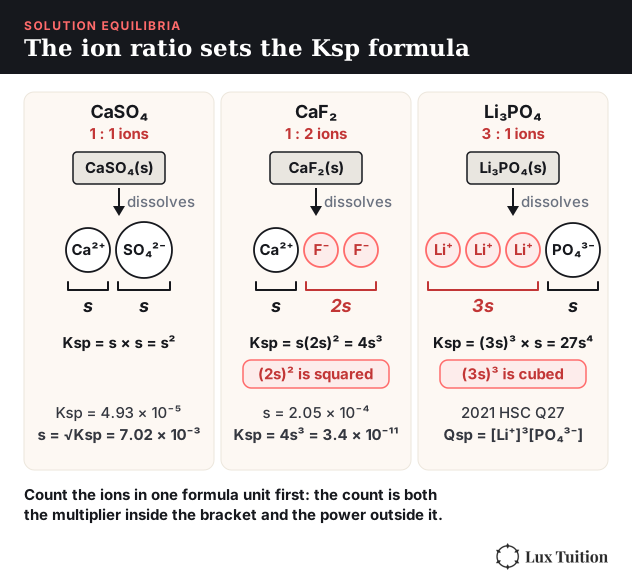
- CaSO4, Ksp = 4.93 × 10⁻⁵. CaSO4(s) ⇌ Ca2+(aq) + SO42−(aq), so Ksp = s2 and s = √(4.93 × 10⁻⁵) = 7.02 × 10⁻³ mol L−1.
- BaSO4, molar solubility 1.05 × 10⁻⁵ mol L−1. Ksp = s2 = (1.05 × 10⁻⁵)2 = 1.10 × 10⁻¹⁰.
- CaF2, solubility 0.016 g L−1 at 20 °C. Convert to moles first: s = 0.016 / 78.08 = 2.05 × 10⁻⁴ mol L−1. Each CaF2 gives one Ca2+ and two F−, so the ICE row is s and 2s: Ksp = s(2s)2 = 4s3 = 3.4 × 10⁻¹¹.
The trap is the last one: when a salt releases two of one ion, that concentration is 2s and gets squared.
The same idea works for any ion ratio. A salt AxBy dissolves as AxBy(s) ⇌ xA(aq) + yB(aq), so if its molar solubility is s, then [A] = xs and [B] = ys, and Ksp = (xs)x(ys)y. This is also why Ksp values can’t be compared directly to rank solubility across salts with different ion ratios: a 1 : 1 salt has Ksp = s2, but a 1 : 2 salt like CaF2 has Ksp = 4s3, so a smaller Ksp doesn’t always mean a lower molar solubility. To compare them, convert each Ksp back into s first.
How to predict whether a precipitate will form
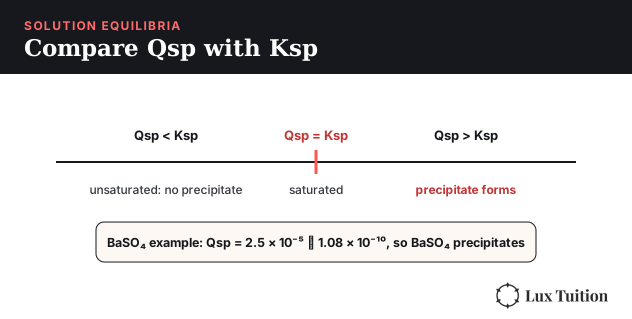
We find Qsp for the dissolution equilibrium and compare it with Ksp.
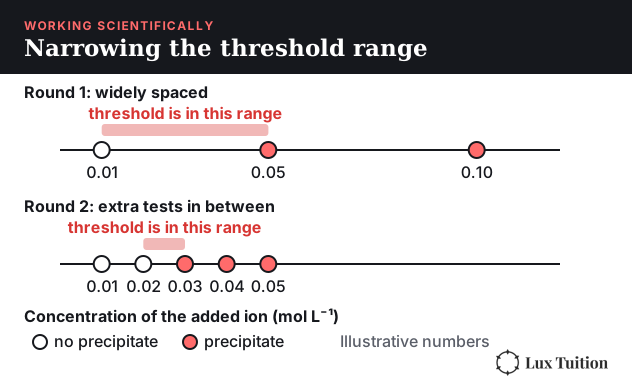
Estimating Ksp by experiment. To estimate Ksp, mix a series of solutions of increasing concentration and note the lowest concentration that first gives a precipitate. Calculate Qsp for each mixture: Ksp lies between the Qsp of the last mixture with no precipitate and the Qsp of the first mixture with one. (In 2021 Q27(a), that interval was 3.4 × 10⁻⁵ to 3.4 × 10⁻⁴.) To make the estimate more precise, test more concentrations between those two: the range narrows and the estimate gets closer to the true value (2021 HSC Q27(b)). The skills section at the end of this page returns to this.
The same method works for barium sulfate. Mixing 100 mL of 0.01 M Ba(NO3)2 with 100 mL of 0.01 M Na2SO4 halves each concentration to 0.005 M, so Qsp = 0.005 × 0.005 = 2.5 × 10⁻⁵. That is far greater than 1.08 × 10⁻¹⁰, so BaSO4 precipitates.
When a precipitate forms, the ions are consumed in the ratio of the formula: one Ba2+ for every SO42−, or one Pb2+ for every two I− in PbI2. If one ion is present in excess, the other ion is almost completely used up and the leftover excess ion stays in solution. BaSO4’s tiny Ksp matters outside the lab too. Ba2+ ions are toxic, but a “barium meal” of BaSO4 is safe to swallow before an X-ray because so little of it dissolves that almost no Ba2+ reaches the body.
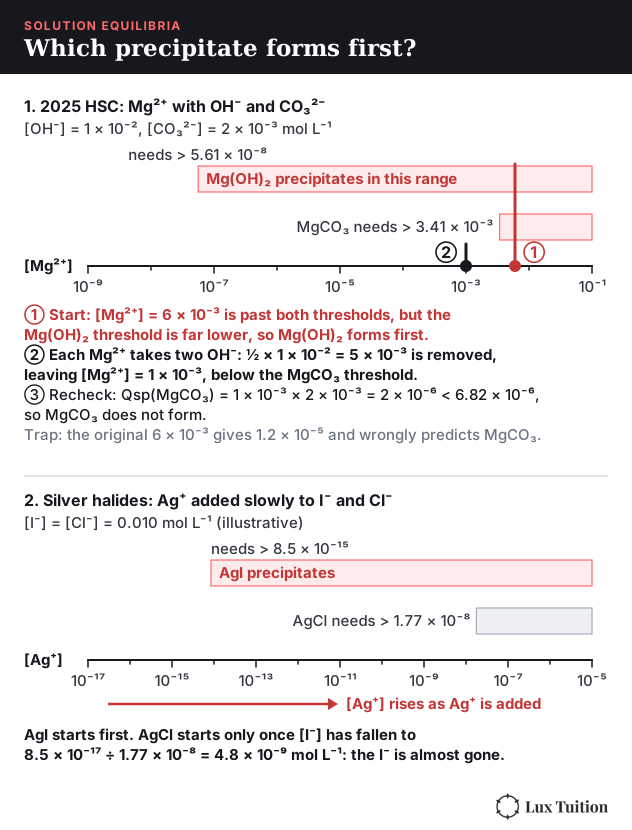
Two possible precipitates sharing an ion. If a mixture could form two precipitates that share an ion, compare the shared-ion concentration needed to reach each Ksp, using the other ion’s actual concentration. The salt with the lower threshold starts precipitating first and uses up some of the shared ion. Work out how much of the shared ion is left, then recheck Qsp for the second salt using that new concentration. In the 2025 HSC, a solution had [Mg2+] = 6 × 10⁻³, [OH−] = 1 × 10⁻² and [CO32−] = 2 × 10⁻³ mol L−1. Mg(OH)2 (Ksp = 5.61 × 10⁻¹²) and MgCO3 (Ksp = 6.82 × 10⁻⁶) differ in the [Mg2+] they need. At the stated anion concentrations, the Mg2+ thresholds are 5.61 × 10⁻⁸ mol L−1 for Mg(OH)2 and 3.41 × 10⁻³ mol L−1 for MgCO3, and the Mg(OH)2 Qsp of 6 × 10⁻⁷ is well above its Ksp, so it precipitates first. Every Mg2+ removed takes two OH− with it, so [Mg2+] falls to about 6 × 10⁻³ − (1 × 10⁻²) / 2 = 1 × 10⁻³ mol L−1. Rechecking, Qsp(MgCO3) = 1 × 10−3 × 2 × 10−3 = 2 × 10⁻⁶, which is less than 6.82 × 10⁻⁶, so MgCO3 does not precipitate. (Using the original [Mg2+] instead gives 1.2 × 10⁻⁵, which would wrongly suggest it forms too.) A lower Ksp or molar solubility alone does not decide which salt forms first, because the concentrations matter.
The same idea explains why silver halides give separate endpoints. AgI (Ksp = 8.5 × 10⁻¹⁷) and AgCl (Ksp = 1.77 × 10⁻¹⁰) have the same 1 : 1 ratio, so the much smaller Ksp means AgI needs far less Ag+ to start precipitating. When Ag+ is added slowly to a mixture of I− and Cl− of similar concentrations, AgI precipitates first and AgCl only starts once almost all the I− is used up: two separate precipitation endpoints.
What is the common ion effect?
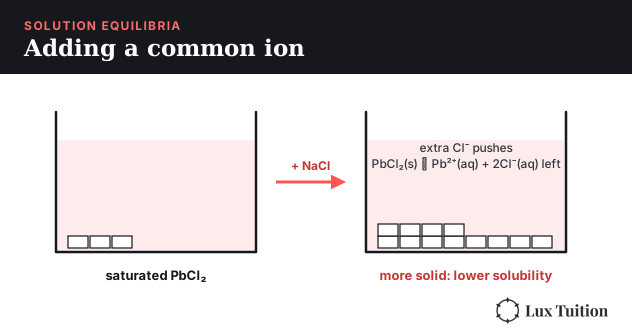
Adding an ion that is already part of a solubility equilibrium pushes that equilibrium to the left, by Le Chatelier’s principle. So the addition of a common ion decreases the solubility of an ionic compound. This is true for both the anion and the cation. For example, adding NaCl (a source of Cl−) or Pb(NO3)2 (a source of Pb2+) to a saturated PbCl2 solution makes less PbCl2 able to dissolve.
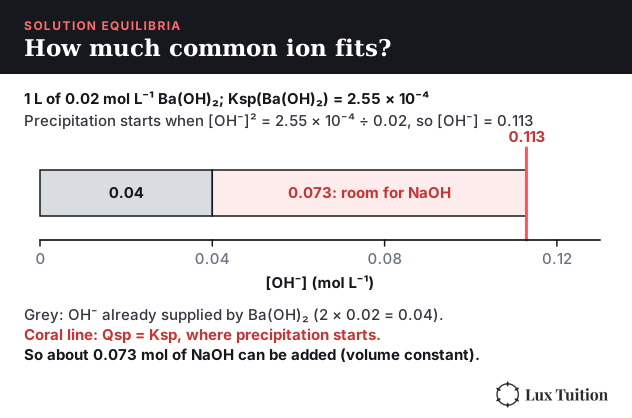
Example. How much NaOH can be added to 1 L of 0.02 M Ba(OH)2 before precipitation occurs? Ksp(Ba(OH)2) = 2.55 × 10⁻⁴. Assume the volume doesn’t change.
- Ksp = [Ba2+][OH−]2, and [Ba2+] = 0.02 M.
- Precipitation begins when [OH−]2 = 2.55 × 10⁻⁴ / 0.02 = 0.01275, so [OH−] = 0.113 M.
- The Ba(OH)2 already supplies 2 × 0.02 = 0.04 M of OH−, so NaOH can add 0.113 − 0.04 = 0.073 mol before a precipitate forms.
A related question (2020 HSC Q33(b)) asks for the pH of a saturated solution of a hydroxide: find [OH−] from Ksp first, then pOH = −log10[OH−] and pH = 14.00 − pOH at 25 °C. See Module 6 for pH.
Working Scientifically skills for Module 5
Many marks in the Chemistry papers reward working scientifically (the skills strand of the syllabus) rather than recall. This section teaches each skill using Module 5 examples and real past questions. The numbers in invented examples are labelled illustrative.
Hypotheses
A hypothesis is a testable, usually directional statement that can be shown wrong by evidence. It does not need a mechanism: “because…” is a good scaffold, not a requirement. The prediction must also cover the range you test, or the result cannot contradict it.
Example. “If a few drops of concentrated HCl are added to the pink cobalt(II) chloride solution at room temperature, the solution will turn bluer.” This is testable and directional, and Le Chatelier’s principle supplies the reason (extra Cl− shifts the equilibrium right). If the evidence does not match, modify the hypothesis and test again; do not quietly drop the result.
Variables and controls
The independent variable (IV) is the one thing you change, the dependent variable (DV) is what you measure, and controlled variables are everything else you keep the same.
Example. In the iron(III) thiocyanate investigation (see the colourimetry steps earlier), the IV is the starting concentration of Fe3+. The DV is absorbance. Controlled: temperature, volume of each solution, wavelength, and the same cuvette. An experimental control is a separate sample that gives a baseline for comparison, for example a blank (the same solution without Fe3+) used to zero the colourimeter. Replicates are several samples made and measured in the same run. Repeats are the whole investigation done again, ideally on another day.
Planning: risks, ethics and materials
For each hazard, state the hazard, the possible harm, and a specific precaution. “Be careful” earns nothing.
- Concentrated HCl (corrosive) can burn skin and eyes, so wear goggles and gloves and keep it to a teacher demonstration or a dilute version.
- Lead(II) nitrate is toxic and silver nitrate is harmful to aquatic life, so collect all precipitates and solutions in a labelled waste container, never down the sink. The ethical issue here is protecting people and the environment from the waste.
- Cobalt(II) chloride is toxic if swallowed, so do not eat or drink in the lab and wash hands afterwards.
Accuracy, precision, validity and reliability
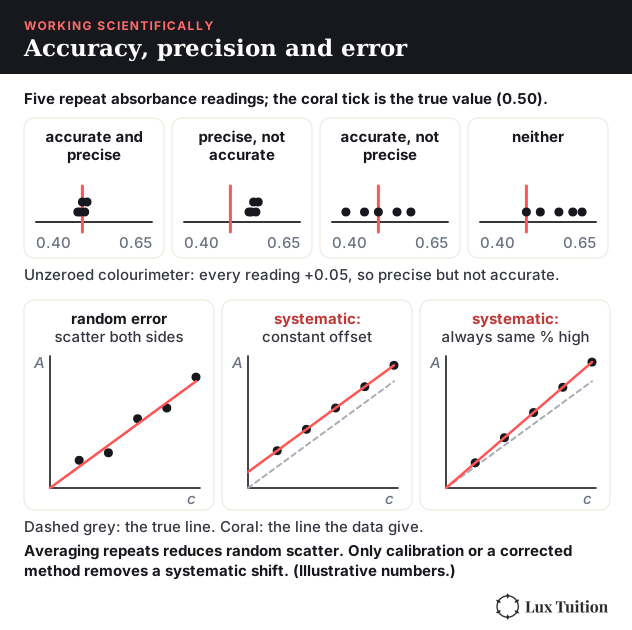
- Accuracy: how close a measurement is to the true value.
- Precision: how close repeated measurements are to each other.
- Validity: the investigation answers the question it claims to. In a controlled experiment, that means only the IV changes.
- Reliability: repeating the investigation gives consistent results.
A colourimeter that was never zeroed can give very precise readings that are all wrong (precise but not accurate).
Calibration, uncertainty and error
Calibration means checking an instrument against known standards. The colourimeter’s calibration curve in Module 5 does exactly this: absorbance is measured for solutions of known concentration, then used to read an unknown.
- Random error scatters readings both ways (judging a colour, reading a meniscus). Averaging independent repeats reduces it.
- Systematic error pushes every reading the same way, either by a constant offset (an unzeroed instrument) or in proportion (always 5% high). Averaging cannot remove it; calibration or a corrected method can.
- Uncertainty is how far a measured value could be from the true one. A common rule of thumb is half the smallest division on the instrument. Example (illustrative). If the calibration graph lets you read the unknown at about 0.046 mol L−1 but the line of best fit could reasonably sit a little higher or lower, you might say the concentration is 0.046 ± 0.002 mol L−1. That is a relative uncertainty of about 4%, and Keq inherits it (and more, because [lactic acid] is squared). State the uncertainty and the limitation it puts on your conclusion.
Evaluating and improving an investigation
Name one weakness, link it to the quality of the result, and give a specific fix. Example (2021 HSC Q27(b)). To estimate Ksp you test mixtures of increasing concentration and note when a precipitate first appears. The fix the marking guideline rewards is to test more concentrations between the last clear mixture and the first cloudy one, which narrows the range and brings the estimate closer to the accepted value (accuracy).
Representing data: choosing and drawing graphs
Categorical data are named groups (salt A, B, C) and go on a column graph with gaps between the columns. Continuous data are numbers on a scale (concentration, time, temperature) and go on a line graph. For two series on one graph, use different symbols and add a key.
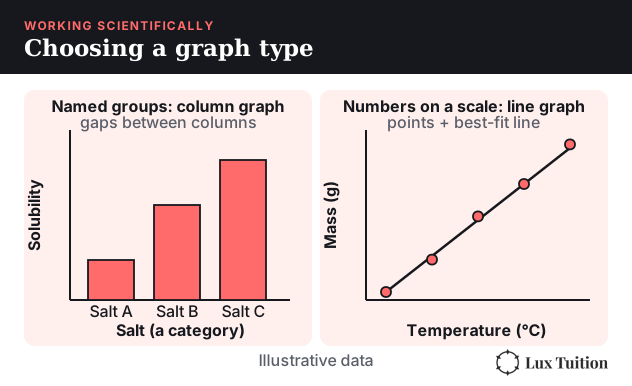
To construct a line graph:
- Put the independent variable on the horizontal axis and the dependent variable on the vertical axis.
- Label each axis with the quantity and its unit, for example “Concentration (mol L−1)”. A ratio such as absorbance has no unit.
- Choose an even scale so the data fill most of the grid, and mark equal steps (not the values of your data).
- Plot each point precisely and clearly.
- Draw a line of best fit through the trend, with points scattered evenly on both sides. Do not join the dots when you are showing an overall relationship or predicting: random error means the points will not sit exactly on a line. (For a time series you recorded, such as concentration against time, joining successive points is fine.)
- Use the line to read values. Interpolation reads between your data and is generally reliable. Extrapolation extends beyond your data and is less reliable, because the pattern may change.
Worked example (2023 HSC Q31, 7 marks). The question gives six absorbance readings for known concentrations of a copper(II) lactate complex and asks for Keq with the support of a line graph. The marks reward a correct graph and then the calculation. Plot the six standards, draw a straight line of best fit through them (it passes close to the origin), read the concentration for the measured absorbance of 0.66 (about 0.046 mol L−1), then use an ICE table to find the other equilibrium concentrations and calculate Keq. Starting from 0.056 mol L−1 Cu2+ and 0.111 mol L−1 lactic acid, 0.046 mol L−1 of complex forms, using up 0.046 of Cu2+ and 2 × 0.046 = 0.092 of lactic acid. That leaves [Cu2+] = 0.010 and [lactic acid] = 0.019, so Keq = 0.046 / (0.010 × 0.0192) = 1.3 × 10⁴.
Graphs you sketch. Past papers also ask you to sketch concentration–time graphs (2019 Q25, 2025 Q27(c)). Label both axes, start from the equilibrium lines, make the disturbance obvious (a vertical jump for an added or removed substance, a smooth curve for a temperature change; see the Haber section), show each line changing in the mole ratio, and end with flat lines at the new equilibrium. Graphs you read. In 2021 Q33(a) you read ΔH and TΔS off a graph at a given temperature (like Module 5 Figure 7), then use ΔG = ΔH − TΔS. Always give the units (kJ mol−1) and check the signs.
Quantitative methods
- Write the formula first, then substitute with units, then give the answer to the right significant figures. In 2021 Q27(a), each mixture gives Qsp = [Li+]3[PO43−], for example 0.153 × 0.010 = 3.4 × 10⁻⁵. The last clear sample and the first cloudy sample bound Ksp between 3.4 × 10⁻⁵ and 3.4 × 10⁻⁴, and the marks reward that range and the correct significant figures.
- Use concentrations (mol L−1) in K and Q, never moles, and divide by the combined volume after mixing.
- Check the answer is reasonable. If the reaction should shift right, Q must be less than K.
Models
A model is a simplified picture that explains and predicts. A particle diagram, an energy profile, collision theory and Le Chatelier’s principle are all models. Each has limits: Le Chatelier’s principle predicts the direction of a shift but not its size or its cause, which is why collision theory is needed to explain it. When asked about a model, say what it predicts, what evidence supports it and where it falls short.
Secondary sources and evidence-based argument
Secondary data come from someone else: the Ksp values on the HSC data sheet, a published solubility table or a news report. Judge a source by who produced it, whether the method is described, whether it agrees with other sources, and whether it is current.
An evidence-based argument states a claim, gives the evidence (a value, a calculation, a graph feature), and links it to the chemistry. Example (2025 HSC Q32, 5 marks). The claim is “only Mg(OH)2 precipitates”. The evidence is Qsp > Ksp for Mg(OH)2, the leftover [Mg2+] of 1 × 10⁻³ mol L−1, and Qsp = 2 × 10⁻⁶ < Ksp for MgCO3. The same habit helps with linked equilibria such as 2024 Q39: show each form of the acid, then conclude.
Peer check. Swap your conclusion with a classmate and ask three questions: does the claim answer the question, does each piece of evidence actually support it (units, signs and values correct), and is anything missing (a limitation, a second disturbance)? Use their feedback to rewrite it.
Acknowledge your sources. Any data or ideas you did not produce need a citation, in the style your school asks for. A NESA-style reference for the data sheet might read: NSW Education Standards Authority (NESA), Chemistry Data Sheet, HSC examination, accessed 2026. Always give the author or organisation, title, year and where you found it.
Command words
Command words guide the shape of your answer, but the question and the evidence decide what is needed. See the NESA glossary of key words.
| Command word | What it usually needs |
|---|---|
| Identify, state | Name or give the answer: one precipitate, one shift direction. |
| Describe | Give the features or what you would observe, for example the colour change. |
| Explain | Give the cause: change, then how the system opposes it, then the result (collision theory for rates). |
| Analyse | Break the data or system into parts and show the relationships or trends, with evidence (for example, each section of a concentration–time graph). |
| Discuss | Give considerations for and against, with evidence and implications, and reach a conclusion. |
| Compare, justify | Compare: similarities and differences. Justify: support your answer with reasons or calculations. |
| Assess, evaluate | Make a judgement supported by evidence, weighing strengths and limitations where both exist. |
HSC Chemistry Module 5 Revision Summary
What Comes After Module 5 in HSC Chemistry?
Module 5 isn’t a standalone topic. The equilibrium ideas come straight back in the rest of the course:
- Module 6: Acid/Base Reactions treats weak acids, Ka, pH and buffers as equilibria, so it’s Module 5 with protons. Our HSC Chemistry Module 6 notes pick up exactly where this page ends.
- Module 8: Applying Chemical Ideas uses precipitation and solubility rules to identify ions in solution.
Year 11 still matters here: our Year 11 Chemistry notes cover the collision theory and energetics this module assumes. For the bigger picture, our ultimate guide to scoring Band 6 in Chemistry covers how to study the HSC course, and a spaced-repetition guide to Anki is a good way to lock in SNAAP and the Le Chatelier shifts.
HSC Chemistry Tutoring in Blacktown
Module 5 is where HSC Chemistry turns from describing reactions to predicting them, and a single wrong coefficient in a K expression costs the whole answer. In our HSC Chemistry tutoring in Blacktown, theory is broken down by our tutors into the smallest possible parts and practised in classes of 1 to 5 students, a few minutes from Blacktown Station. Check our pricing page, or book a free trial with no obligations.
Frequently Asked Questions
What is Module 5 in HSC Chemistry?
Module 5 is Equilibrium and Acid Reactions, the first of four Year 12 modules in the NSW Chemistry Stage 6 Syllabus. It covers static and dynamic equilibrium, Le Chatelier's principle, the equilibrium constant, and solubility equilibria including Ksp and precipitation.
What is the difference between static and dynamic equilibrium?
In dynamic equilibrium, the forward and reverse reactions keep happening at equal rates, so concentrations stay constant even though particles are still reacting. In static equilibrium nothing is reacting at all. Chemical equilibria are described as dynamic because both reactions always continue to some degree.
How do you apply Le Chatelier's principle?
Identify the change (temperature, concentration, pressure or volume), then state how the system can oppose it: absorbing added heat through the endothermic direction, using up an added substance, or making fewer moles of gas when pressure rises. State the direction of the shift and what you would observe. Adding a catalyst never shifts the position.
What changes the value of the equilibrium constant?
Only temperature. Changing concentration, pressure or volume moves the equilibrium position, but the system shifts until the ratio of products to reactants returns to the same K. For an endothermic reaction K increases with temperature, and for an exothermic reaction it decreases.
What is the difference between Q and K?
K is the ratio of products to reactants at equilibrium. Q uses the same expression at any moment. If Q is smaller than K the reaction shifts towards the products, if Q is larger it shifts towards the reactants, and if they are equal the system is at equilibrium.
How do you know if a precipitate will form?
Work out the concentration of each ion after mixing, using the combined volume, then calculate Qsp with the Ksp expression. If Qsp is greater than Ksp, the solution holds more ions than it can, so a precipitate forms. If Qsp is less than or equal to Ksp, it doesn't.
Learn it properly with a specialist tutor at Blacktown or online across NSW. Enquire about a free trial — no cost, no obligation. See online formats and class sizes.
Realistic study tips to help you prepare better for assessments with less stress, plus a printable study planner