
What is an acid and what is a base? It sounds like a Year 8 question, but Module 6 shows that chemists changed their answer several times, and the model you pick decides which reactions you can explain. From there the module gets quantitative fast: pH calculations, titrations, titration curves and buffers make up a big share of every HSC paper. This page is part of our HSC Chemistry notes, which summarise all four Year 12 modules in one place.
These HSC Chemistry Module 6 notes follow the three inquiry questions of Module 6: Acid/Base Reactions in the NSW Chemistry Stage 6 Syllabus. They’re written from the lessons our tutors teach in class, and each topic opens with the exact syllabus dot point it covers. Module 6 treats weak acids as equilibria, so read our HSC Chemistry Module 5 notes first if K and ICE (Initial, Change, Equilibrium) tables aren’t solid yet.
These are theory and revision notes with the key worked examples solved in full. Reading notes doesn’t replace the practical investigations the syllabus asks you to do in class. The Working Scientifically skills section near the end teaches investigation design, graphs and evidence with Module 6 examples.
Key Takeaways
- Arrhenius: acids produce H+ in water and bases produce OH−. Brønsted–Lowry: an acid is a proton donor and a base is a proton acceptor, which works outside water too.
- pH = −log10[H+], and at 25 °C pH + pOH = 14 because Kw = [H3O+][OH−] = 1.0 × 10⁻¹⁴.
- Strength is how completely an acid or base ionises; concentration is how much is dissolved. They’re independent.
- Titration finds an unknown concentration using a standard solution. The equivalence point is pH 7 (at 25 °C) only for a strong acid with a strong base.
- Ka and pKa = −log10Ka measure acid strength: a stronger acid has a larger Ka and a smaller pKa.
- A buffer is a conjugate acid–base pair at high concentration that resists small changes in pH, like the bicarbonate buffer in blood.
For how to study all this effectively, see how to actually understand HSC Chemistry.
What Does HSC Chemistry Module 6 Cover?
Module 6 is the second of four Year 12 modules in the NESA Chemistry Stage 6 Syllabus (2017). It’s organised around three inquiry questions, and these notes follow the same order:
| Syllabus section | Inquiry question |
|---|---|
| Properties of Acids and Bases | What is an acid and what is a base? |
| Using Brønsted–Lowry Theory | What is the role of water in solutions of acids and bases? |
| Quantitative Analysis | How are solutions of acids and bases analysed? |
What Is an Acid and What Is a Base?
Properties of common acids and bases
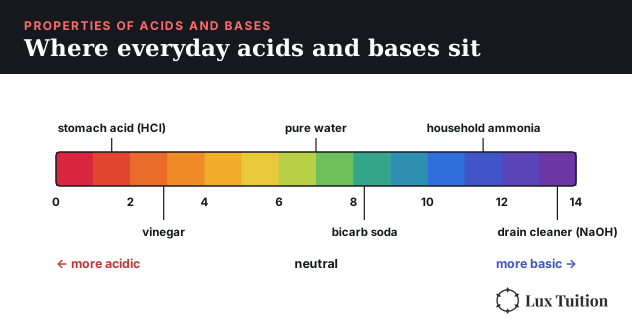
Acids typically are corrosive and taste sour. They produce hydrogen ions (H+), which exist in solution as hydronium ions (H3O+), and they have a pH below 7 (pH is a scale of acidity, explained below).
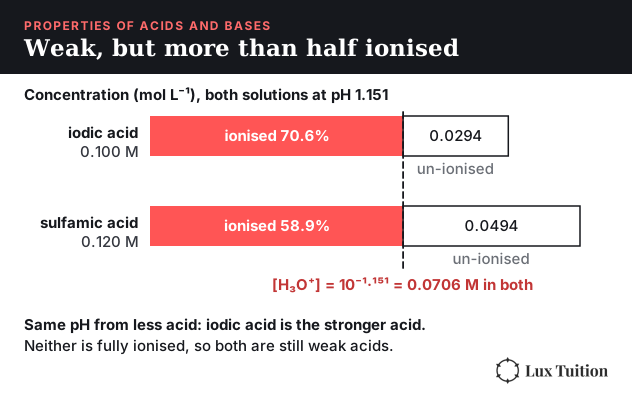
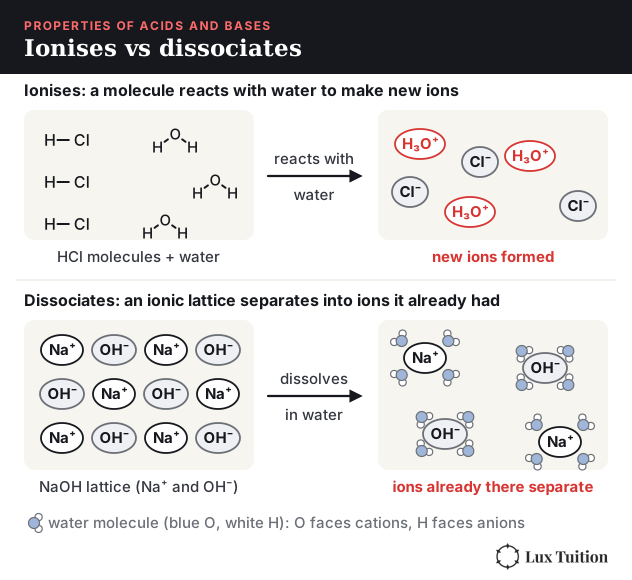
Acids and bases are described as strong or weak according to how completely they react with water. A strong acid reacts completely to form ions, while a weak acid only partly does. Weak acids ionise incompletely, and the fraction can exceed 50%: in the 2024 HSC question, 0.100 mol L−1 iodic acid and 0.120 mol L−1 sulfamic acid both have [H3O+] = 10−1.151 = 0.0706 mol L−1, so they are 70.6% and 58.9% ionised. Both are weak, but iodic acid is stronger, because less of it is needed to give the same pH. Two verbs describe how ions form. A molecular substance ionises: it reacts with water to make ions that weren’t there before, as HCl does to form H3O+ and Cl−. An ionic compound dissociates: the ions already in its lattice separate as it dissolves, as NaOH does to release Na+ and OH−. Module 6 Figure 2 shows the iodic and sulfamic acid numbers, and Module 6 Figure 3 contrasts the two verbs.
- Hydrochloric acid (HCl): strong, found in the stomach
- Acetic acid (ethanoic acid): weak, the main component of vinegar
- Sulfuric acid (H2SO4): strong, used to make fertiliser
- Nitric acid (HNO3): strong, used to make fertilisers and explosives
Bases typically taste bitter, have a soapy feel, and are also corrosive. They have a pH above 7, and bases that are soluble in water are often called alkalis. Bases are often used as cleaners because they react with insoluble fats and oils to produce water-soluble soaps, which can be washed away.
Common inorganic bases fall into a few families: metal hydroxides such as sodium hydroxide, metal oxides such as calcium oxide, carbonates and hydrogencarbonates such as sodium carbonate and sodium hydrogencarbonate, and ammonia. A basic oxide is a metal oxide that neutralises acids, like calcium oxide. A basic salt is a salt that forms a basic solution in water, like sodium hydrogencarbonate; the salts section below explains why.
- Ammonia (NH3): weak, used in fertiliser
- Sodium hydroxide (NaOH): strong, used as drain cleaner
- Sodium bicarbonate (NaHCO3): weak, used in baking
- Calcium hydroxide (Ca(OH)2): strong, used in water treatment
How to name inorganic acids
An oxyanion is a negative ion made of oxygen bonded to another element, such as nitrate, NO3−, or phosphate, PO43−.
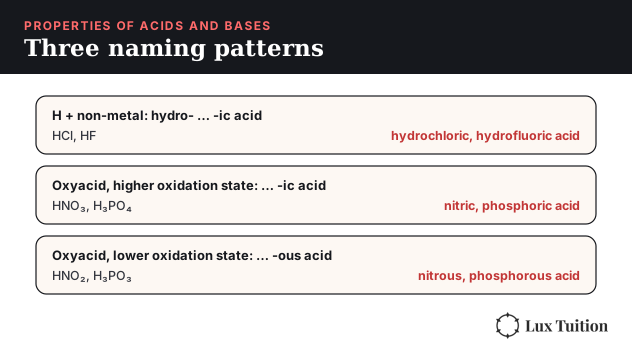
- Hydrogen + a non-metal: start with “hydro”, add the non-metal, change its ending to “-ic” and add “acid”. HCl is hydrochloric acid and HF is hydrofluoric acid.
- Hydrogen + an oxyanion: ignore the hydrogen, change the non-metal ending to “-ous” (lower oxidation state, a number for the charge the atom would have if every bond were treated as ionic) or “-ic” (higher oxidation state), and add “acid”. HNO3 is nitric acid, H3PO4 is phosphoric acid and H3PO3 is phosphorous acid.
How do acid–base indicators work?
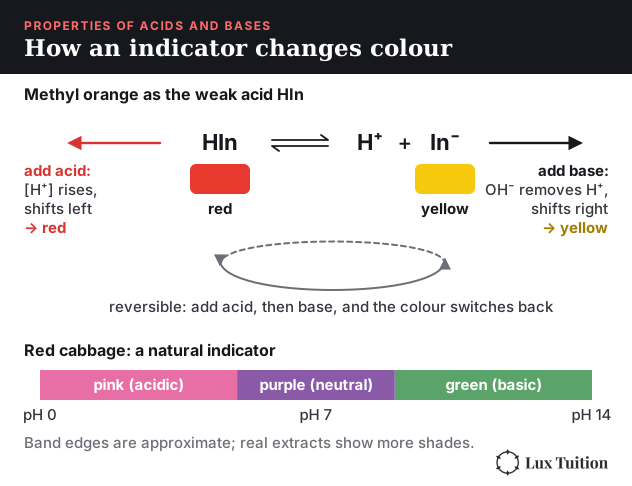
Indicators are weak acids or bases which change colour according to the pH of a solution. They do this by reversibly reacting with H+ to form a different coloured compound. Writing the indicator as the weak acid HIn:
HIn(aq) ⇌ H+(aq) + In−(aq)
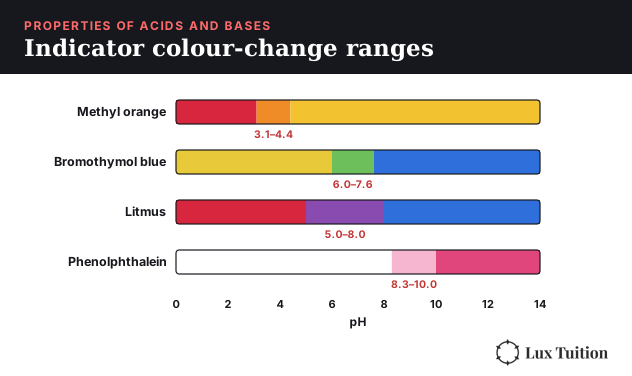
HIn and In− have different colours. By Le Chatelier’s principle (a system at equilibrium shifts to oppose a change), adding acid raises [H+] and shifts the equilibrium left, so the colour of HIn shows. Adding base removes H+ (OH− reacts with it to form water), so the equilibrium shifts right and the colour of In− shows. Different indicators have different pH ranges in which they change colour:
- Methyl orange is red below pH 3.1, orange between 3.1 and 4.4, and yellow above pH 4.4.
- Litmus is red in acidic solutions and blue in basic ones, changing gradually over a broad range around pH 7 (roughly pH 5.0 to 8.0).
- Bromothymol blue is yellow below pH 6.0 and blue above pH 7.6.
- Phenolphthalein is colourless below about pH 8.3 and turns bright pink by about pH 10.
The smaller the pH range of the colour change, the more precisely the indicator marks a particular pH. A simple natural indicator can be prepared by boiling red cabbage: the solution is purple, turning pink at low pH (acidic) and green at high pH (basic). To show that the colour change is reversible, add acid to a tube of indicator until the colour changes, then add base to the same tube: the colour switches back, because the equilibrium shifts the other way. A pH probe measures pH more precisely, and without affecting the solution.
What do acids react with?
Our Year 11 Module 3 notes introduce neutralisation and acid/carbonate reactions.
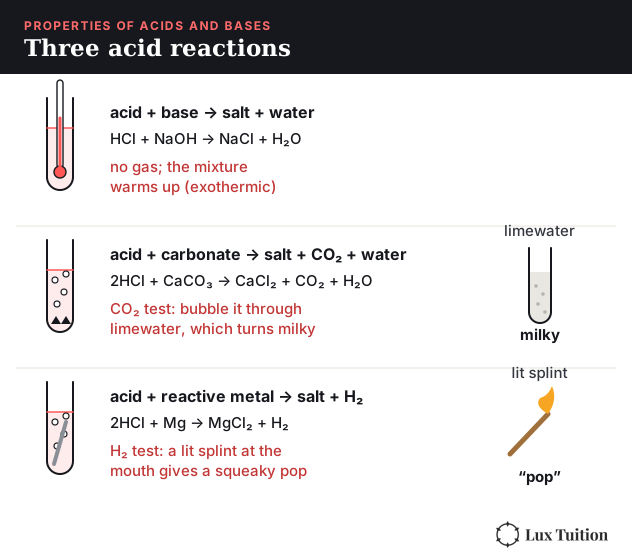
- Acid + base → salt + water (with ammonia, just a salt: NH3 + HCl → NH4Cl). HCl(aq) + NaOH(aq) → NaCl(aq) + H2O(l). This is a neutralisation reaction.
- Acid + metal carbonate → salt + carbon dioxide + water. 2HCl(aq) + CaCO3(s) → CaCl2(aq) + CO2(g) + H2O(l)
- Acid + reactive metal → salt + hydrogen gas. 2HCl(aq) + Mg(s) → MgCl2(aq) + H2(g) This pattern applies to reactive metals with dilute, non-oxidising acids such as hydrochloric acid. Nitric acid and concentrated sulfuric acid can behave differently.
Neutralisation in everyday life and industry
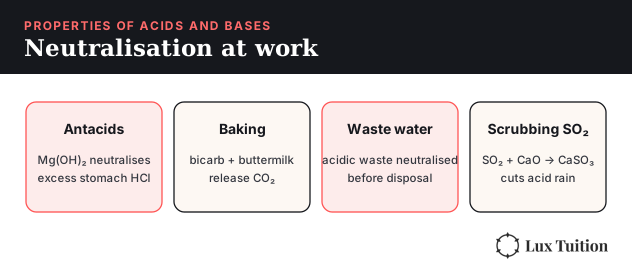
- Antacid tablets treat indigestion by neutralising stomach acid. Many contain magnesium hydroxide: Mg(OH)2(s) + 2HCl(aq) → MgCl2(aq) + 2H2O(l)
- Baking: bicarb soda (a basic salt) makes cakes fluffy by reacting with acidic buttermilk in the mixture to produce carbon dioxide.
- Industrial waste: factories may produce acidic liquid waste that must be neutralised with a base before it can be disposed of.
- Air pollution: copper extraction and burning fossil fuels produce sulfur dioxide, an acidic, toxic gas. It can be removed by reacting it with calcium oxide, a basic oxide: SO2(g) + CaO(s) → CaSO3(s)
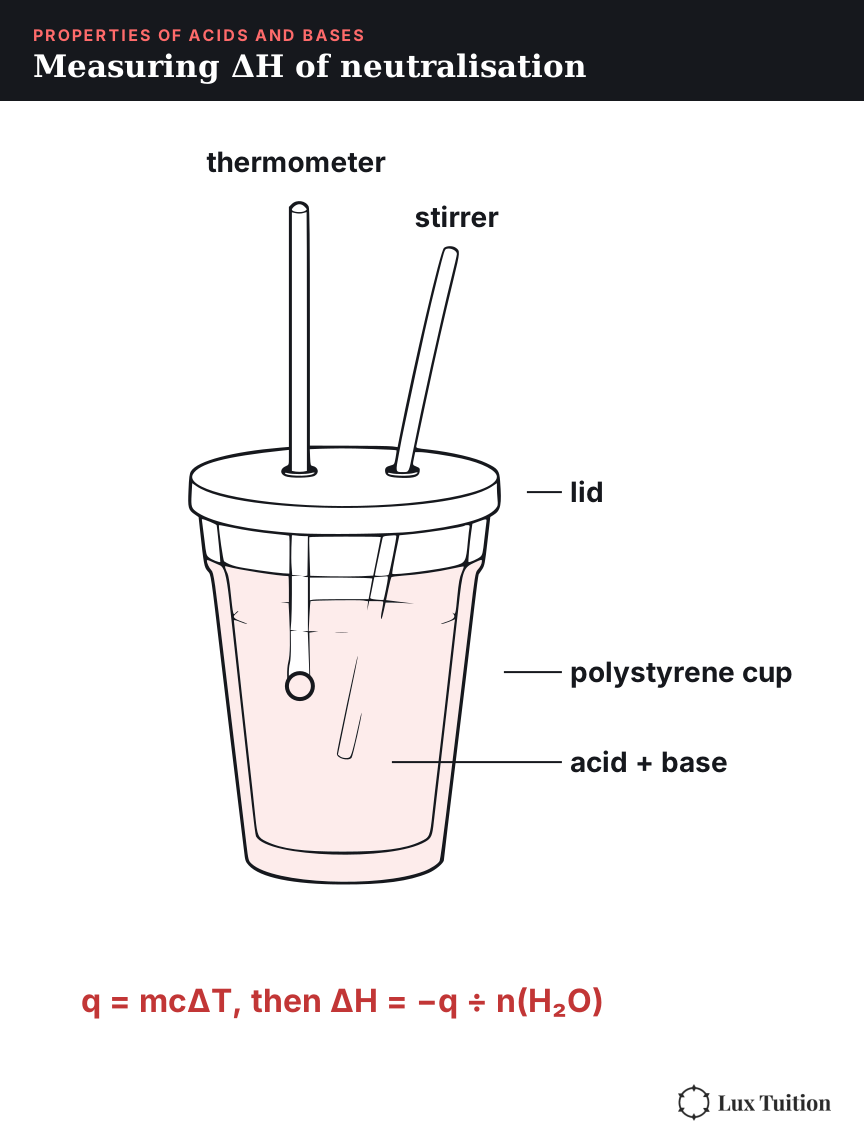
How to calculate the enthalpy of neutralisation
This uses the calorimetry and q = mcΔT from our Year 11 Module 4 notes.
The enthalpy of neutralisation (ΔHneut) is the energy change when an acid reacts with a base to neutralise it, per mole of water formed. Neutralising an acid with a hydroxide is exothermic, so energy is released (some other acid reactions absorb heat instead, as shown below). The energy change can be measured with calorimetry using q = mcΔT:
- q: energy released (J)
- m: mass of the solution (g), assuming it has the density of water, 1 g mL−1
- c: specific heat capacity of water, 4.18 J g−1 K−1
- ΔT: temperature change of the mixture (K or °C)
Practical method.
- Measure the volumes of acid and base accurately, and let both solutions reach the same starting temperature (record it) so there is one starting temperature for ΔT.
- Pour the base into the acid in an insulated cup, stir gently, and record the temperature at regular intervals. The highest reading is the final temperature.
- Repeat the whole measurement at least twice more and average the results, to check reliability.
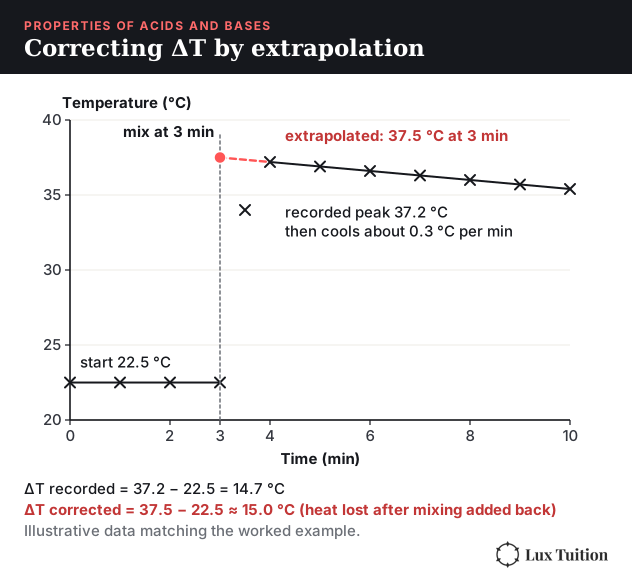
Example. 75.0 mL of NaOH solution (containing at least as many moles as the acid) neutralises 75.0 mL of 2.5 mol L−1 ethanoic acid. The temperature rises from 22.5 °C to 37.2 °C.
- m = 75.0 + 75.0 = 150 g, and ΔT = 37.2 − 22.5 = 14.7 °C
- q = 150 × 4.18 × 14.7 = 9217 J = 9.22 kJ
- n(ethanoic acid) = 2.5 × 0.0750 = 0.1875 mol, which forms 0.1875 mol of water
- ΔHneut = −q/n = −9.22 / 0.1875 = −49.2 kJ mol−1 (negative because heat is released)
Watch the stoichiometry with bases like Ba(OH)2, which neutralises two moles of acid per mole of base: always count the moles of water formed.
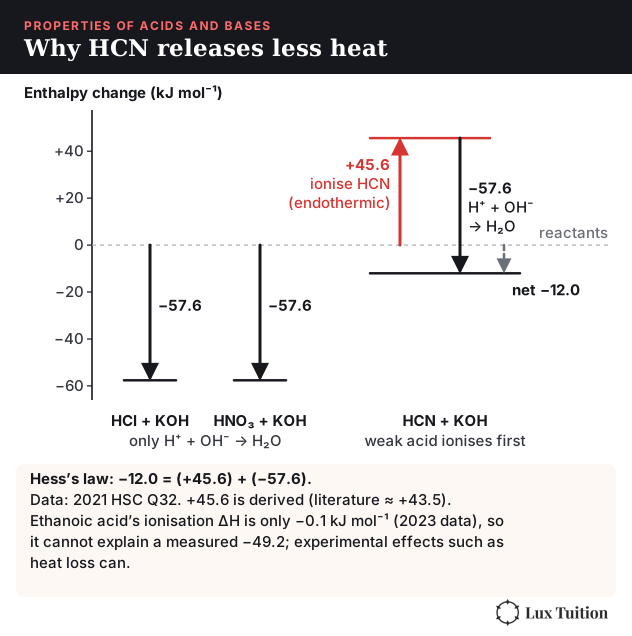
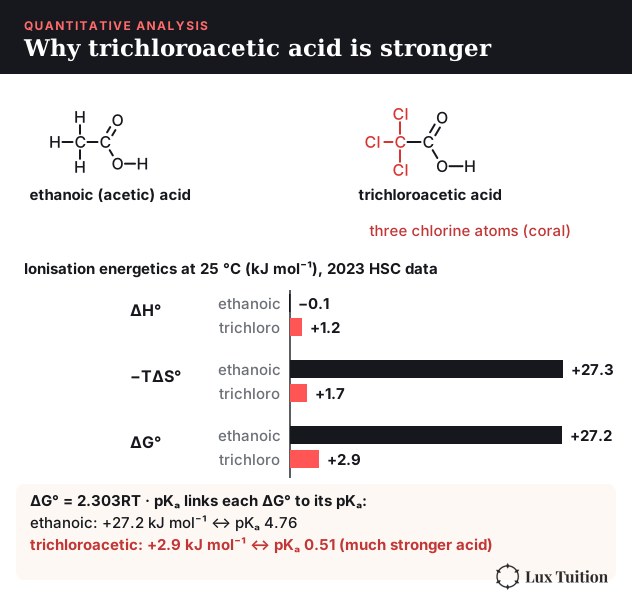
Why the weak-acid value is smaller. For any strong acid with a strong base, ΔHneut is about −57 kJ mol−1, because the only reaction is H+(aq) + OH−(aq) → H2O(l); the other ions are spectators. A weak acid is incompletely ionised; how much remains un-ionised depends on its strength and concentration. Ionising it can take in energy (the ionisation of HCN is endothermic, for example), so usually less energy is released overall. The effect varies from acid to acid: the 2023 HSC data give ΔH° of only −0.1 kJ mol−1 for ionising ethanoic acid. The ethanoic acid result above, −49.2 kJ mol−1, is less exothermic than −57 kJ mol−1. Endothermic ionisation, as for HCN, can make neutralisation less exothermic. Ethanoic acid’s supplied ionisation enthalpy cannot explain this measured difference; experimental effects such as heat loss can. In 2021 HSC question 32, HCl and HNO3 with KOH both gave −57.6 kJ mol−1 but HCN gave only −12.0 kJ mol−1, so by Hess’s law ionising HCN absorbs about +45.6 kJ mol−1 (Module 6 Figure 11).
Take the sign from the data. Not every acid reaction releases heat: sodium hydrogencarbonate with HCl absorbs it, so the solution cools. If the temperature falls, q for the solution is negative and ΔH for the reaction is positive. In the 2024 HSC question, 14.7 g of NaHCO3 (0.175 mol) reacted with excess HCl and the solution cooled from 21.5 °C to 11.5 °C. Using the mass left after the CO2 escapes (129 g) and c = 3.80 J g−1 K−1 gives q = −4.92 kJ and ΔH = +28.1 kJ mol−1. Ignoring the lost CO2 (137.1 g) gives +29.8 kJ mol−1, and the marking guideline accepts both.
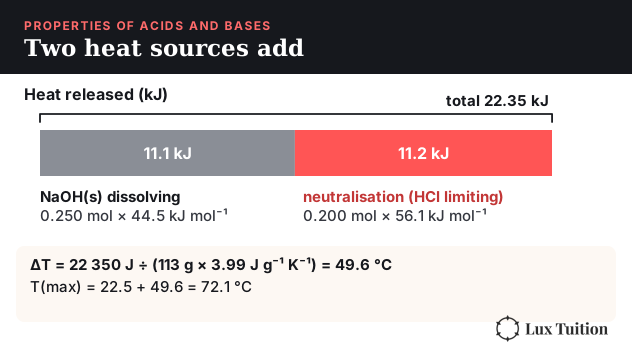
Two starting temperatures, two heat sources. If the two solutions start at slightly different temperatures, use their average, which is fair when the two solutions have about the same heat capacity (otherwise add m1c1(Tf − T1) + m2c2(Tf − T2)): 21.0 °C and 21.2 °C average 21.1 °C, so with a final 24.4 °C (ΔT = 3.3 °C) and 202.7 g of solution, q = 202.7 × 4.18 × 3.3 = 2.80 kJ. If a solid dissolves as well as reacting, work out the heat from each process separately and add them. In 2020 HSC question 36, 0.250 mol of NaOH dissolving (ΔH = −44.5 kJ mol−1) releases 11.1 kJ, and the 0.200 mol that neutralises (HCl is limiting; ΔH = −56.1 kJ mol−1) releases 11.2 kJ. The total of 22.35 kJ heats 113 g of solution (c = 3.99 J g−1 K−1) by 49.6 °C, so the maximum temperature is 22.5 + 49.6 = 72.1 °C (the acid started at 22.5 °C).
How have models of acids and bases changed over time?
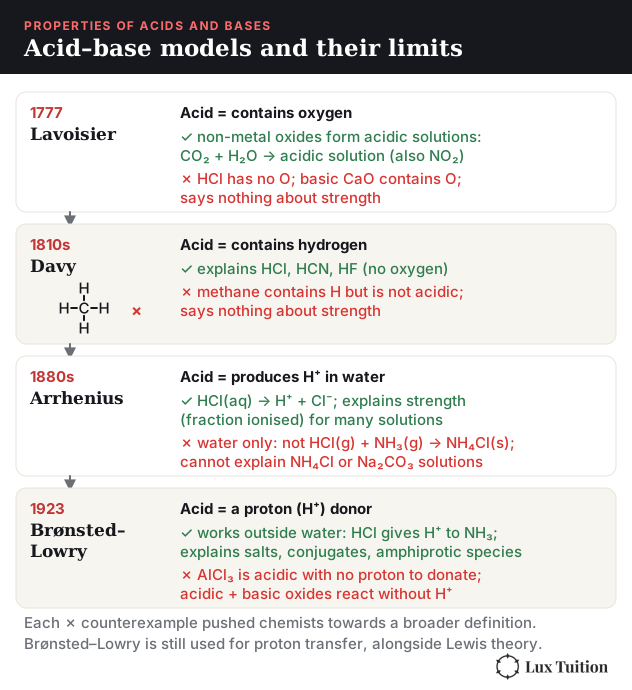
Lavoisier proposed that oxygen makes substances acidic, since non-metal oxides such as CO2 form acidic solutions. But basic metal oxides like CaO also contain oxygen. Davy showed that HCl contains no oxygen and proposed that acids contain hydrogen instead, yet methane (CH4) isn’t acidic, and his model still didn’t explain why some acids are stronger than others.
Arrhenius gave the first modern model to explain the acidity and basicity of aqueous solutions. Arrhenius acids produce H+ ions when they dissociate in water (e.g. HCl), and Arrhenius bases produce OH− ions (e.g. NaOH). The strength of an acid or base depends on the fraction of it that dissociates or ionises, so compare acids (or bases) at the same concentration: the one that produces the bigger increase in H+ or OH− concentration is the stronger. When an Arrhenius acid reacts with an Arrhenius base, salt and water are produced.
Brønsted and Lowry defined an acid as a proton (H+) donor and a base as a proton acceptor. When an acid (HA) reacts, it donates its proton to form its conjugate base (A−). When a base (B) reacts, it receives a proton to form its conjugate acid (HB+). Both reactions are reversible: HA + B ⇌ A− + HB+. A conjugate acid–base pair is simply two species which differ by one proton. A species that can either donate or accept a proton, such as water, is amphiprotic. The model accounts for gas-phase neutralisation such as HCl(g) + NH3(g) → NH4Cl(s), and it is one of the most commonly used models in modern chemistry.
What Is the Role of Water in Solutions of Acids and Bases?
Amphiprotic substances
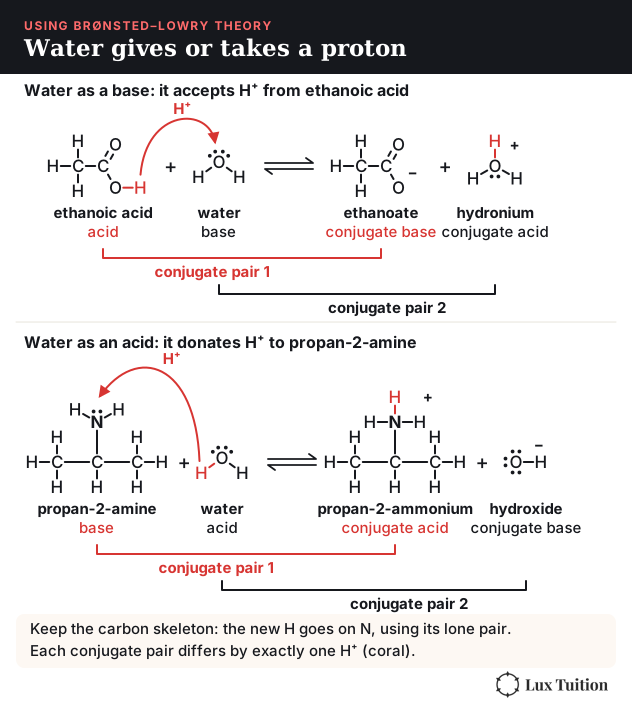
An amphiprotic substance can act as either an acid or a base, depending on what it reacts with. Water is the key example:
- As a base, reacting with an acid: HCl(aq) + H2O(l) → Cl−(aq) + H3O+(aq)
- As an acid, reacting with a base: NH3(aq) + H2O(l) ⇌ NH4+(aq) + OH−(aq)
Amines as bases. An amine is an organic relative of ammonia (see our Module 7 notes). Like NH3, the nitrogen atom has a lone pair of electrons that can accept H+, so amines are Brønsted–Lowry bases: amine + H2O ⇌ ammonium ion + OH−. When propan-2-amine accepts a proton from water it becomes the propan-2-ammonium ion, drawn in full in Module 6 Figure 15: keep the carbon skeleton and add the proton to the nitrogen. A carboxylate ion (such as ethanoate, the conjugate base of a carboxylic acid) is a base too, so when an HSC question shows one beside an amine, both are bases.
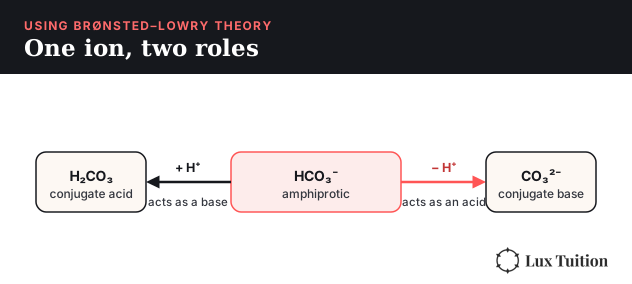
The hydrogen carbonate ion from sodium hydrogen carbonate is also amphiprotic: HCO3− + H2O ⇌ CO32− + H3O+ (acting as an acid), and HCO3− + H2O ⇌ H2CO3 + OH− (acting as a base). The dihydrogen phosphate ion, H2PO4−, behaves the same way.
Polyprotic acids
Some acids can donate more than one proton: polyprotic acids, such as H3PO4 and H2SO4. They donate their protons step by step:
- H2SO4(aq) + H2O(l) → HSO4−(aq) + H3O+(aq)
- HSO4−(aq) + H2O(l) ⇌ SO42−(aq) + H3O+(aq)
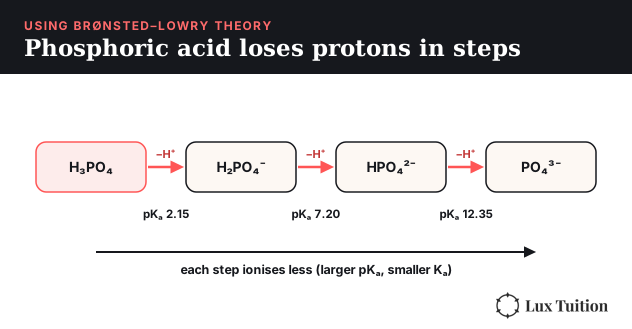
Each successive ionisation happens to a smaller extent than the one before. H2SO4 is a strong acid that readily donates its first proton, so almost no H2SO4 molecules are found in solution. The HSO4− ion is a much weaker acid and only partially dissociates, shown by the reversible arrow. Phosphoric acid goes H3PO4 → H2PO4− → HPO42− → PO43−, with the first step occurring the most and the last the least.
An acid that donates one proton, like HCl, is monoprotic; H2SO4 is diprotic and H3PO4 is triprotic. Each step has its own acid dissociation constant, Ka, the equilibrium constant for that ionisation (covered fully in the Ka section below). Its logarithm, pKa = −log10Ka, is smaller for a stronger acid. For a polyprotic acid, Ka1 > Ka2 > Ka3, because each later proton must be removed from a more negatively charged ion, which attracts the positive proton more strongly.
Adding two ionisations. When you add two equilibrium equations, you multiply their equilibrium constants: Koverall = Ka1 × Ka2. Equivalently, add the pKa values, because adding logarithms is the same as multiplying the numbers. For sulfurous acid (pKa1 = 1.82, pKa2 = 7.17), adding H2SO3 + H2O ⇌ H3O+ + HSO3− and HSO3− + H2O ⇌ H3O+ + SO32− cancels the HSO3− and gives H2SO3 + 2H2O ⇌ 2H3O+ + SO32−. Its constant is K = 10−1.82 × 10−7.17 = 10−8.99 ≈ 1.0 × 10⁻⁹, the value in the 2021 HSC marking guideline.
Phosphoric acid matters well beyond the lab: it gives cola drinks their sharp taste, and it is used to make the phosphate fertilisers that farming depends on.
Measuring pH. pH can be measured with universal indicator, which gives an approximate value from its colour, or with a pH meter or probe, which gives a precise digital reading. Across a range of substances, acids read below 7, bases above 7 and neutral solutions at 7, and the reading reflects both the strength and the concentration of each one. To measure pH with a meter, calibrate it first with buffers of known pH, rinse the probe with distilled water between samples, and wait until the reading is steady before recording it.
How to calculate pH and pOH
pH is a measure of hydrogen ion concentration:
pH = −log10[H+] (also written pH = −log10[H3O+])
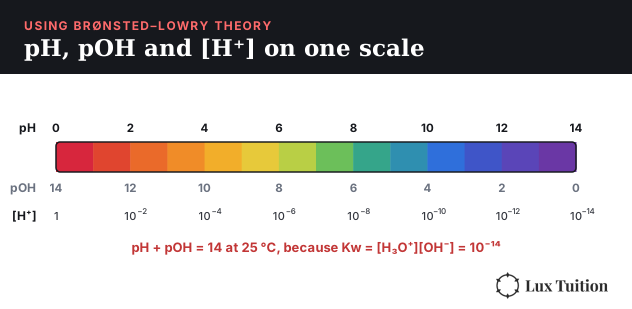
The negative logarithm simplifies the numbers: rather than writing an H+ concentration of 0.01 M (M means mol L−1, moles per litre), we just write pH = 2. The lower the pH, the more acidic the solution; the higher the pH, the more basic. At pH 7 (pure water at 25 °C) the solution is neutral. Going the other way, [H+] = 10−pH.
Base strength can be described with pOH = −log10[OH−]. This comes from the auto-ionisation of water. Pure water acts as an acid and a base with itself:
H2O(l) + H2O(l) ⇌ H3O+(aq) + OH−(aq) Kw = [H3O+][OH−] = 1.0 × 10⁻¹⁴ at 25 °C
Taking −log of both sides gives pH + pOH = 14, so if we know pH we can find pOH, and vice versa. For example, if pH = 1, pOH = 14 − 1 = 13.
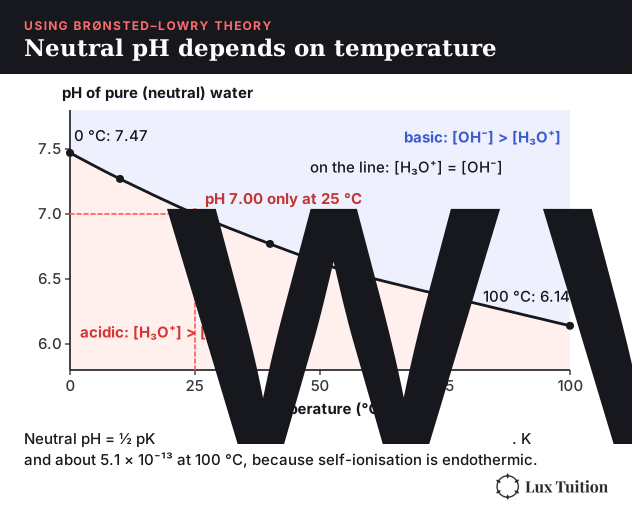
Kw depends on temperature. The self-ionisation of water is endothermic, so by Le Chatelier’s principle heating shifts it right and Kw increases. Pure water is always neutral, because [H3O+] = [OH−] at every temperature, but its pH is only 7 at 25 °C. Above 25 °C, [H3O+] is higher and neutral pH is below 7; below 25 °C, neutral pH is above 7. The relationship pH + pOH = 14 also holds only at 25 °C. Module 6 Figure 18 plots neutral pH from 0 °C to 100 °C.
Worked examples:
- [H+] = 0.005 M: pH = −log(0.005) = 2.30
- [OH−] = 0.003 M: pOH = 2.52, so pH = 14 − 2.52 = 11.48
- 0.2 M HCl (strong, so fully ionised): [H3O+] = 0.2 M, pH = 0.70, pOH = 13.30, [OH−] = 10−14 / 0.2 = 5.0 × 10⁻¹⁴ M
- 0.002 M Ba(OH)2: each unit releases two OH−, so [OH−] = 0.004 M, pOH = 2.40 and pH = 11.60
Using pH to compare strength. pH only reveals strength in a fair test: compare acids, or bases, at the same concentration. Then the stronger acid produces more H3O+ and gives the lower pH, and the stronger base produces more OH− and gives the higher pH, as the next section shows. Use the same concentration for the acids and for the bases: for example 0.1 M HCl against 0.1 M ethanoic acid, and 0.1 M NaOH (pH about 13) against 0.1 M NH3 (pH about 11).
Strong vs weak, concentrated vs dilute
In Brønsted–Lowry terms, strong acids readily donate a proton: HCl completely ionises. With weak acids, only part of the acid ionises in water (often a small proportion, though it can exceed 50%), so their equations use reversible arrows: ethanoic acid(aq) + H2O(l) ⇌ ethanoate(aq) + H3O+(aq), drawn in full in Module 6 Figure 15. Similarly, strong bases readily accept protons.
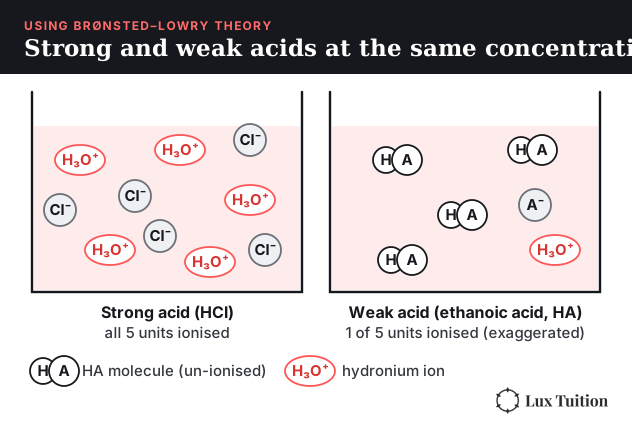
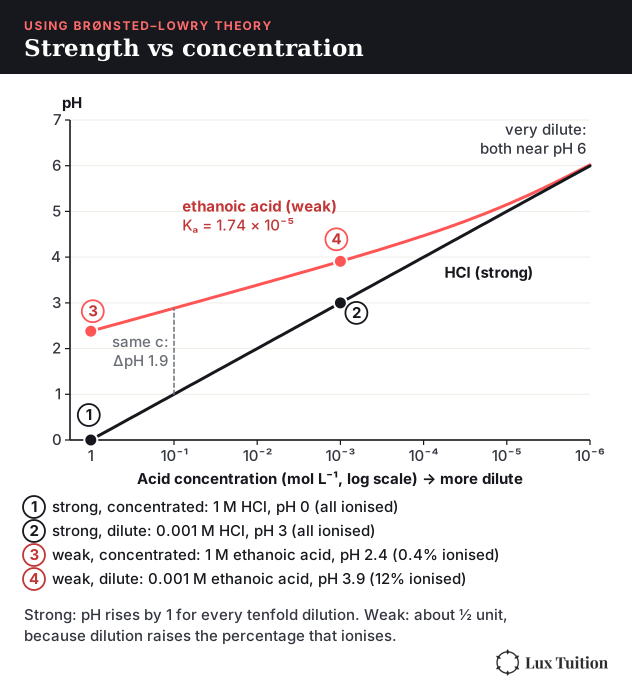
The concentration of an acid or base is separate from its strength. A strong acid could be concentrated or dilute, and so could a weak acid. At the same concentration, the strong acid has the lower pH: 0.1 M HCl has a pH of 1, while 0.1 M ethanoic acid has a pH of about 2.9.
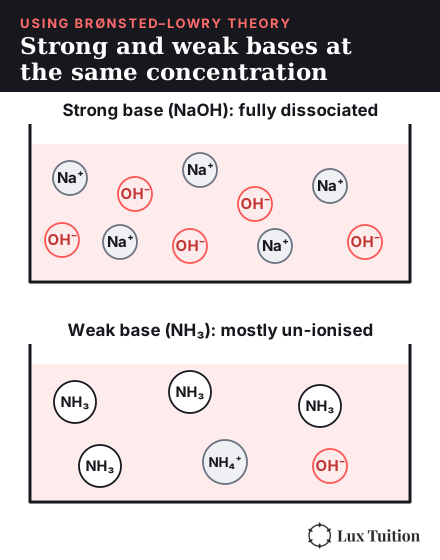
Bases follow the same pattern. Sodium hydroxide is an ionic compound that dissociates completely, so every unit becomes Na+ and OH−. Ammonia is a weak base: only a small fraction of NH3 molecules take a proton from water to form NH4+ and OH−, so most stay as molecules. At the same concentration the strong base gives the higher pH. Concentration is still separate: 1 M NH3 is concentrated but weak, and 0.001 M NaOH (pH 11) is dilute but strong.
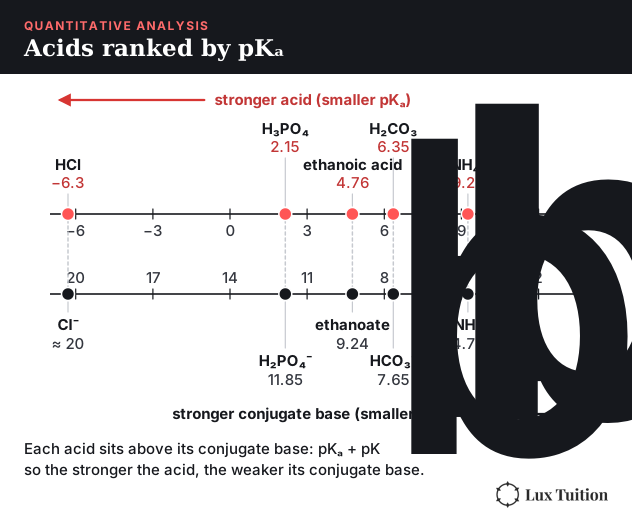
Conjugate strength. The stronger the acid, the weaker its conjugate base. Cl− is the conjugate base of HCl (a strong acid), so it is an extremely weak base, while ethanoate is the conjugate base of a weak acid, so it is a weak base. Similarly, the stronger the base, the weaker its conjugate acid: H2O is the conjugate acid of OH− (a strong base) and is an extremely weak acid.
Are salts acidic, basic or neutral?
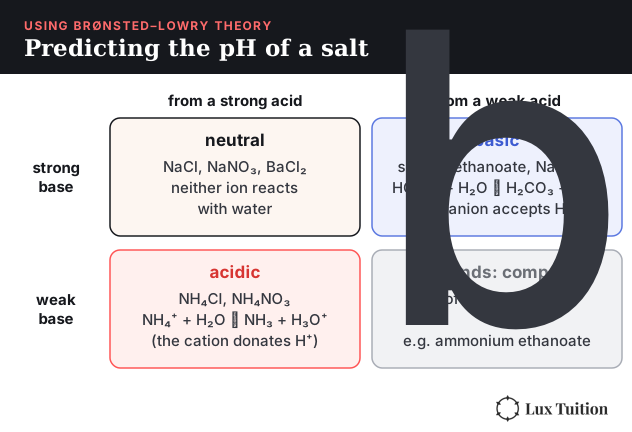
A salt dissociates in water into its ions. To predict its pH, decide whether each ion is the conjugate of a strong or weak acid or base:
- Conjugates of a strong base and strong acid: neutral, e.g. NaCl, NaNO3, BaCl2
- Conjugates of a weak base and strong acid: acidic, e.g. NH4Cl, NH4NO3. The NH4+ donates a proton to water.
- Conjugates of a strong base and weak acid: basic, e.g. sodium ethanoate, barium ethanoate, NaHCO3. The anion accepts a proton from water, releasing OH−.
- Conjugates of a weak base and weak acid: depends on the relative strengths of the two.
How to calculate pH after dilution or mixing
Dilution with c1V1 = c2V2 is covered in our Year 11 Module 2 notes.
For dilution, use c1V1 = c2V2, then find the pH of the new concentration.
Dilution example. 10 mL of 0.005 M NaOH is diluted with 100 mL of water.
- Before: [OH−] = 0.005 M, pOH = 2.30, pH = 11.70
- After: c2 = (0.005 × 10) / 110 = 4.55 × 10⁻⁴ M, pOH = 3.34, pH = 10.66
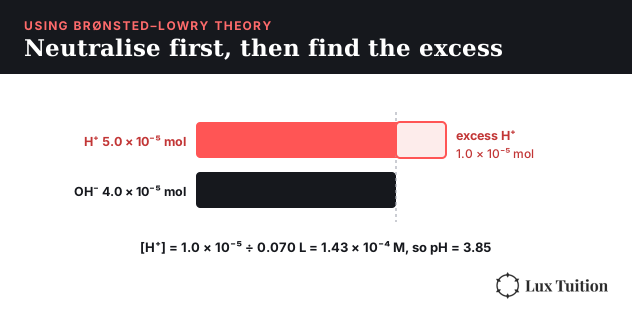
For mixing an acid with a base, the H+ and OH− neutralise each other mole for mole, and whichever is in excess sets the pH.
Mixing example. 50 mL of 0.001 M HCl is mixed with 20 mL of 0.002 M NaOH.
- n(H+) = 0.001 × 0.050 = 5.0 × 10⁻⁵ mol; n(OH−) = 0.002 × 0.020 = 4.0 × 10⁻⁵ mol
- H+ is in excess by 1.0 × 10⁻⁵ mol
- Total volume = 70 mL, so [H+] = 1.0 × 10⁻⁵ / 0.070 = 1.43 × 10⁻⁴ M
- pH = 3.85
Two traps: count two OH− per Ba(OH)2, and always divide by the combined volume.
How Are Solutions of Acids and Bases Analysed?
Quantitative analysis determines quantities such as the pH, volume and concentration of unknown substances, by measuring and calculating mass, volume and concentration. It solves real problems: finding the acid content of a soft drink or a wine, or how much stomach acid an antacid tablet will neutralise.
What is titration?
Titration is a laboratory technique used to find the concentration of an unknown substance. We react the unknown solution with a solution of accurately known concentration and volume, called a standard solution.
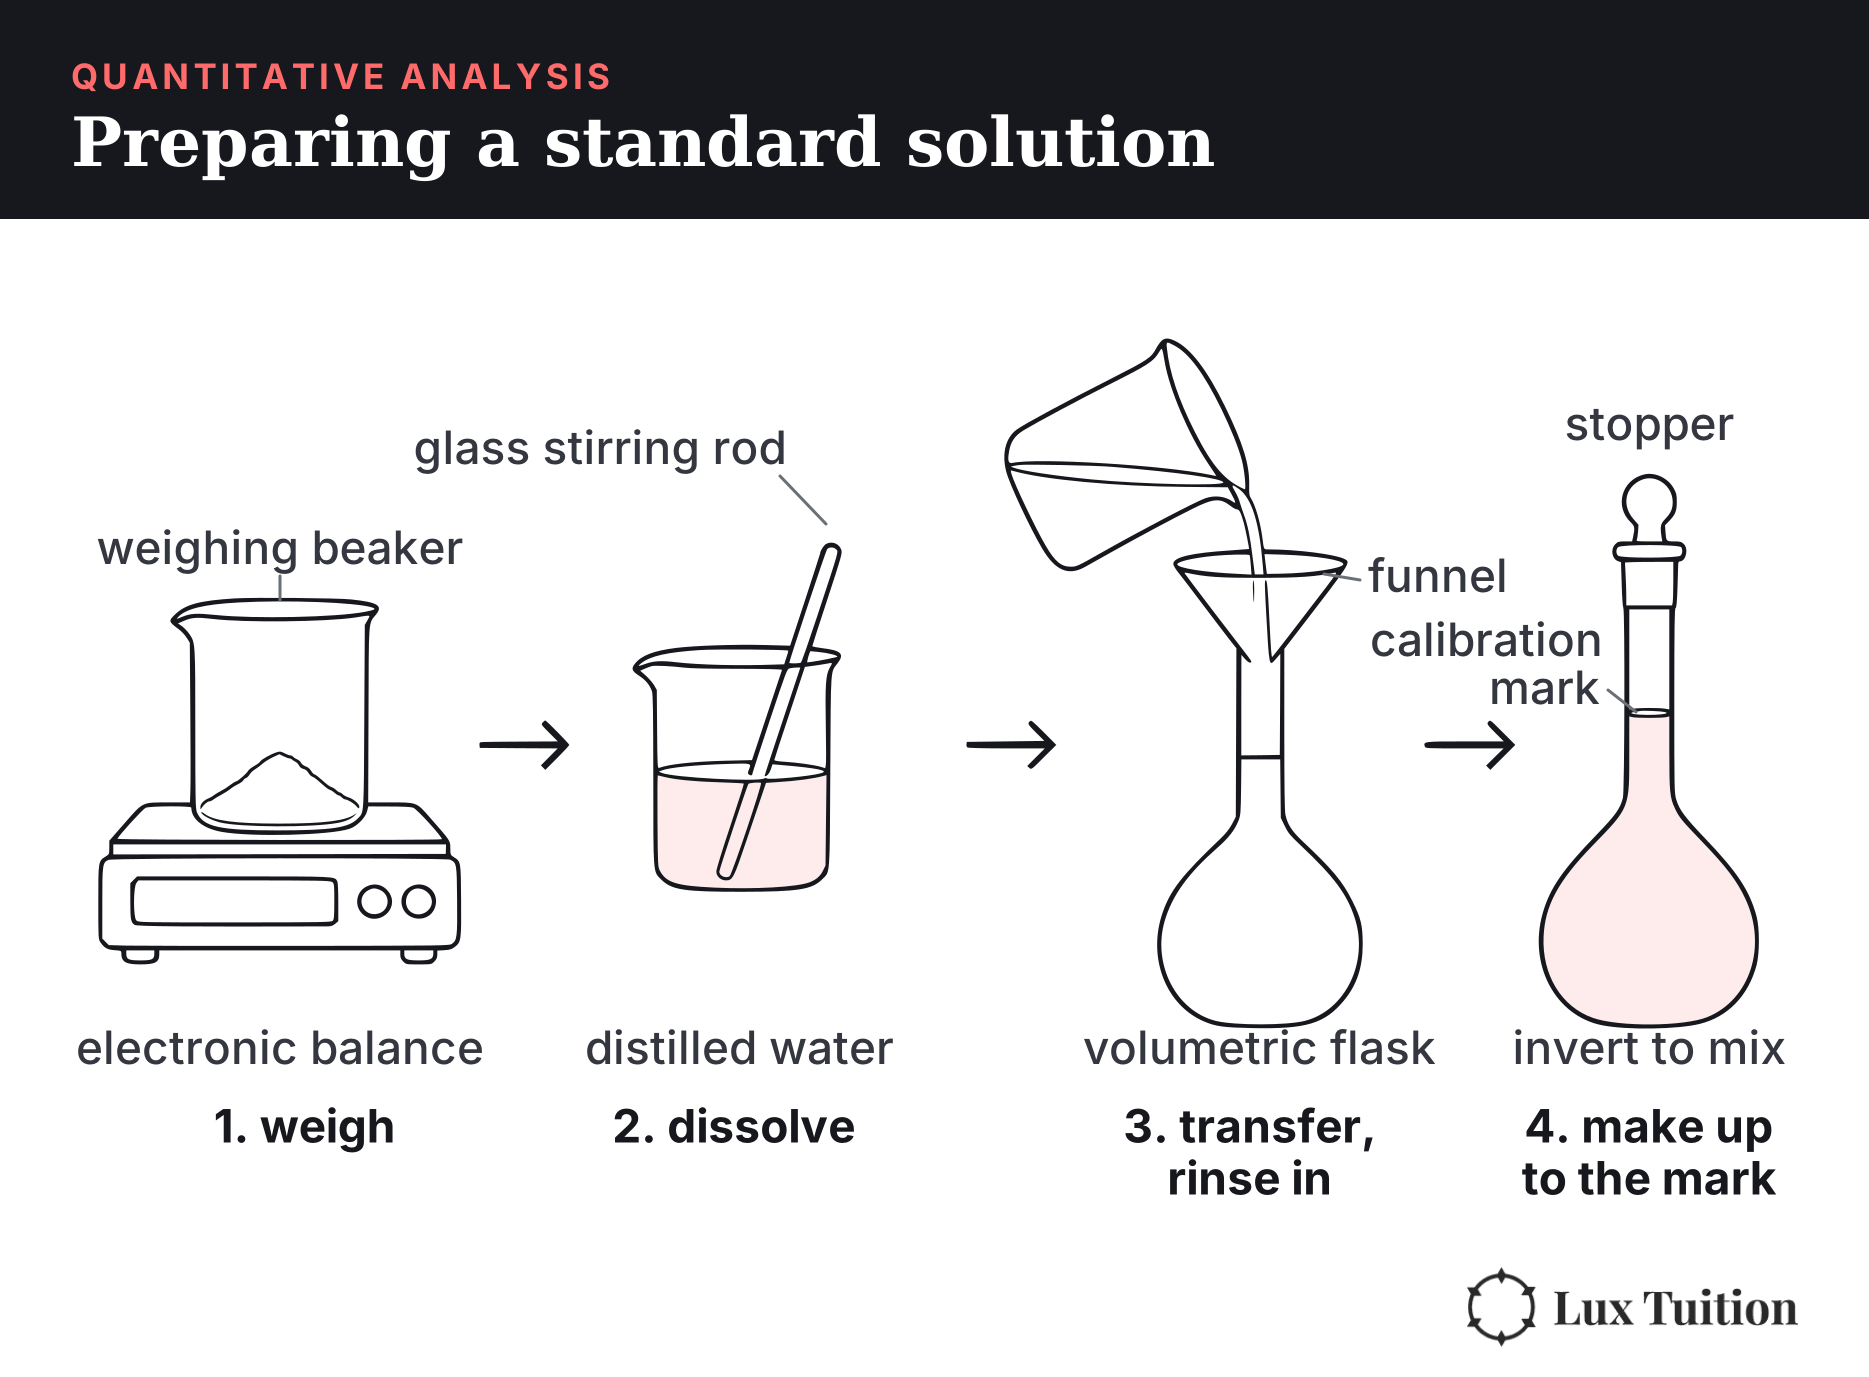
Standard solutions are prepared from primary standards. A primary standard must be highly pure, so its moles can be calculated accurately from its mass. It should also be:
- Highly stable in solution, without deteriorating or reacting with the atmosphere. Strong bases such as NaOH are not suitable primary standards because they absorb water and carbon dioxide from the air, changing their concentration over time.
- High molar mass, which minimises weighing errors.
- Easily obtainable in pure form.
Examples are anhydrous sodium carbonate (Na2CO3) and potassium hydrogen phthalate (KHC8H4O4). A secondary standard, such as NaOH solution, can’t be weighed out accurately, so its exact concentration is found by titrating it against a primary standard such as potassium hydrogen phthalate (KHP) before it is used. This is called standardising the solution.
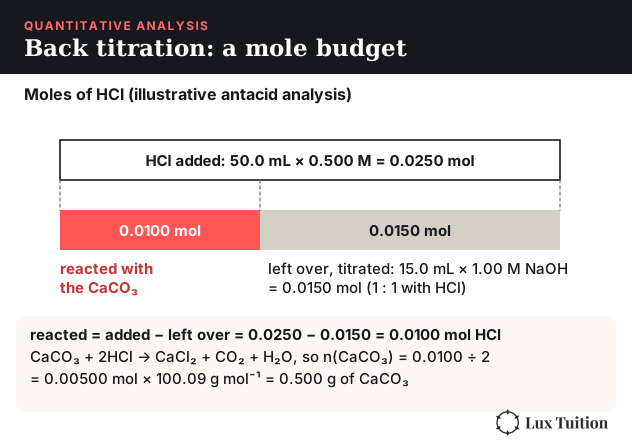
Back titration. Sometimes the sample can’t be titrated directly: it is insoluble, like the CaCO3 in chalk or an antacid tablet, it reacts slowly, or it has no clear end point. Instead, a known excess of a reagent such as HCl is added so that all the sample reacts. The leftover reagent is then titrated, and the difference between the amount added and the amount left over is the amount that reacted with the sample. See our Module 8 back titration notes for how this is applied. Module 6 Figure 25 works through illustrative numbers.
Titration technique
Our Year 11 Module 2 notes cover measuring volumes accurately and making a standard solution.
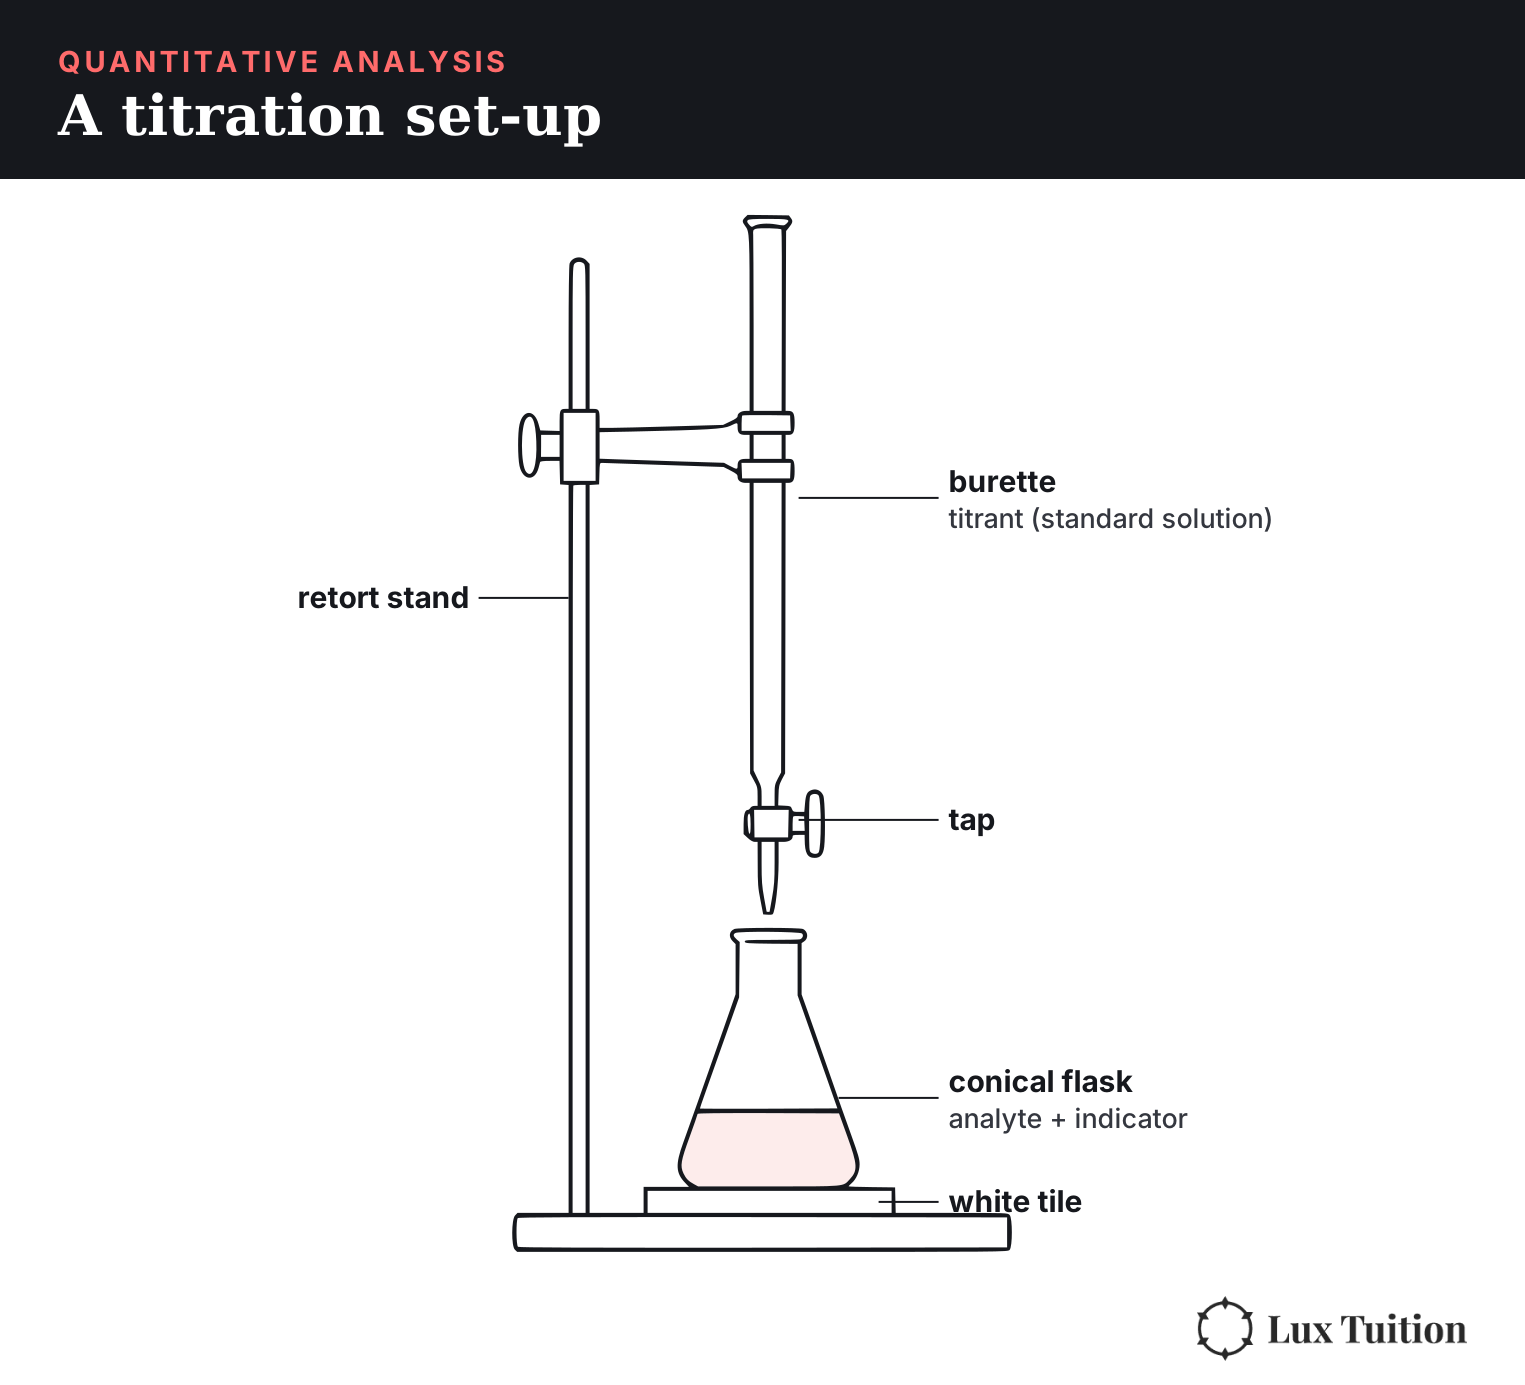
- An accurate volume of the unknown solution (the analyte) is measured with a pipette into a conical flask, and a suitable indicator is added.
- A burette is filled with the standard solution (the titrant), which is added to the flask until enough has been added to completely neutralise the analyte. This is the equivalence point.
- The titration stops at the end point, when the indicator permanently changes colour.
- The moles of analyte are calculated from the volume of titrant used (the titre) and the stoichiometry of the reaction.
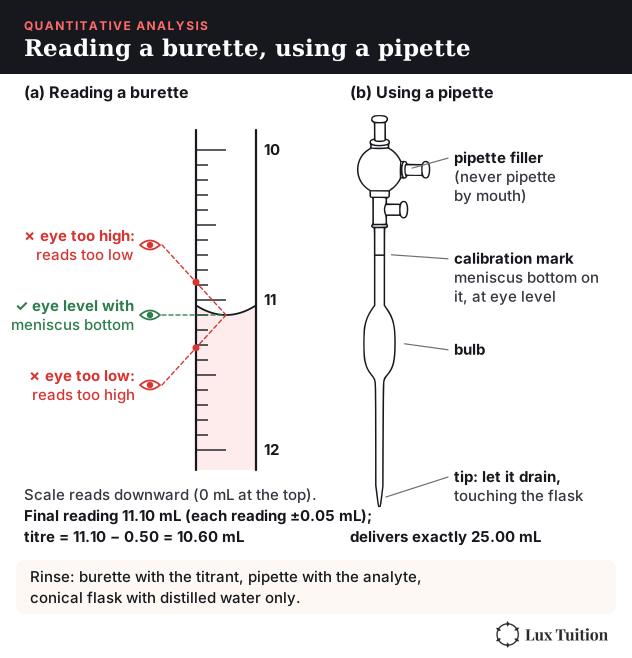
All glassware is rinsed with distilled water. The burette and pipette are then rinsed with the solution they will hold, so the solutions aren’t diluted by unknown amounts of water. The conical flask is rinsed with distilled water only, since water there doesn’t change the moles of analyte. Readings are made at eye level from the bottom of the meniscus to avoid parallax error. The first titration is a rough titration to find the approximate end point. Reliability comes from repeating the titration at least three more times and averaging those titres, not including the rough one. Module 6 Figure 27 shows the meniscus readings and the pipette.
Titration calculation. 25 mL of HNO3 is titrated with 1 M NaOH. Titres: rough 11.30 mL, then 10.60, 10.55 and 10.65 mL.
- Average titre (excluding the rough) = (10.60 + 10.55 + 10.65) / 3 = 10.60 mL
- n(NaOH) = 1 × 0.01060 = 0.0106 mol = n(HNO3), since they react 1:1
- c(HNO3) = 0.0106 / 0.025 = 0.424 M
In the data, look out for titres that aren’t concordant (within about 0.1 mL of each other). An obvious outlier is left out of the average rather than included.
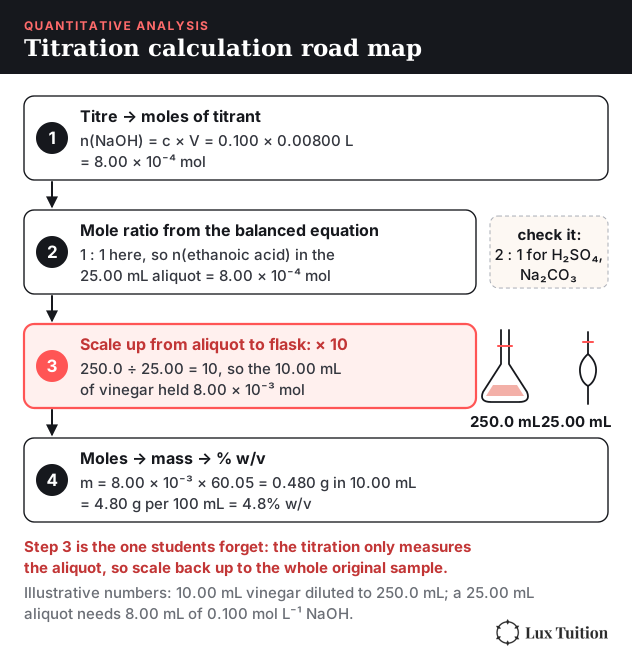
Stoichiometry traps. Always take the mole ratio from the balanced equation, because it isn’t always 1:1. H2SO4 + 2NaOH → Na2SO4 + 2H2O needs two moles of NaOH per mole of acid, and Na2CO3 + 2HCl → 2NaCl + CO2 + H2O needs two moles of HCl per mole of carbonate. Watch for aliquots too. A concentrated sample is often diluted in a volumetric flask, and only a measured portion (an aliquot) of the diluted solution is titrated. The titration gives the moles in the aliquot only, so scale them back up by the ratio of the flask volume to the aliquot volume to find the moles in the original sample. The household-substance worked example below follows every step of this chain (Module 6 Figure 48).
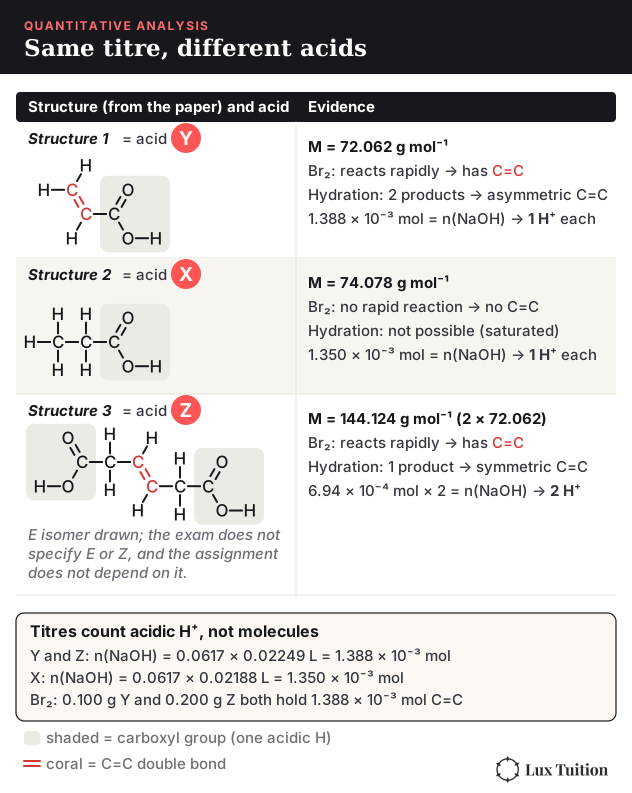
Same titre, different acids. A titre counts moles of acidic protons, not moles of acid. Suppose 0.100 g of acid Y (molar mass 72.062 g mol−1) and 0.100 g of acid Z (144.124 g mol−1) both neutralise 22.49 mL of 0.0617 mol L−1 NaOH. Z has twice the molar mass, so 0.100 g holds only half as many moles of Z, and equal titres mean each molecule of Z must release twice as many H+: Z is diprotic and Y is monoprotic. This is the titration half of 2024 HSC question 35, where three acids X, Y and Z had to be matched to Structures 1 (72.062 g mol−1), 2 (74.078 g mol−1) and 3 (144.124 g mol−1). The full argument: X did not react rapidly with bromine, so it has no C=C and is Structure 2. Y and Z both did, so both have C=C. Equal bromine consumption by 0.100 g of Y and 0.200 g of Z supports Z having twice Y’s molar mass. Z’s single hydration product indicates a symmetrical C=C, whereas Y’s two products indicate an asymmetrical one. With the equal titres, Y is Structure 1 and diprotic Z is Structure 3. The bromine and hydration tests are organic chemistry: see our Module 7 notes. Module 6 Figure 28 draws the three structures beside the evidence that assigns each one.
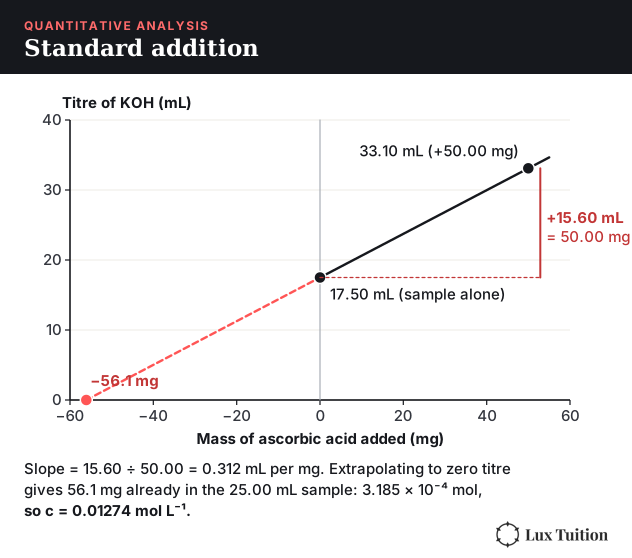
Standard addition. Sometimes the titrant’s concentration isn’t known. Titrate one sample, then titrate an identical sample with a known mass of the same acid added: the extra titre is the volume that known mass needed. In the 2024 HSC question, 25.00 mL of ascorbic acid solution (M = 176.124 g mol−1) needed 17.50 mL of KOH, and 33.10 mL once 50.00 mg of ascorbic acid was added.
- Extra titre = 33.10 − 17.50 = 15.60 mL, which neutralised the added 0.05000 g ÷ 176.124 g mol−1 = 2.839 × 10⁻⁴ mol
- The original sample needed 17.50 mL, so it held 2.839 × 10−4 × 17.50 ÷ 15.60 = 3.185 × 10⁻⁴ mol
- c = 3.185 × 10⁻⁴ mol ÷ 0.02500 L = 0.01274 mol L−1
How to read titration curves
A titration curve plots pH against the volume of titrant added. It’s especially useful for coloured analytes like juice or wine, where an indicator colour change is hard to see.
For a polyprotic acid whose Ka values are far enough apart, the curve shows a separate equivalence point for each proton titrated.
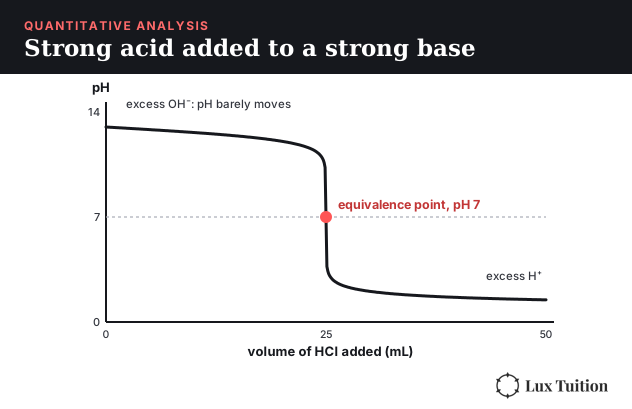
For a strong acid added to a strong base, notice the key features:
- There is little change in pH as the first amounts of acid are added. The acid swiftly reacts with the base, and there are so many OH− ions from the excess base that the pH barely moves.
- Near the equivalence point, almost all the base has been neutralised. A very small volume of acid then causes a large pH drop, because all of a sudden H+ ions dominate OH−.
- The pH plateaus again at a low pH as excess acid is added.
The equivalence point is when enough acid and base have been added to completely neutralise each other, and it appears at the midpoint of the steep section. For a strong acid and strong base it is at pH 7 at 25 °C (neutral pH shifts with temperature, as in the Kw section above), because the net reaction is H+ + OH− → H2O, and the leftover ions (e.g. Na+, Cl−) are such weak conjugates that they don’t react with water. Starting with a strong acid and adding a strong base gives the mirror image: low pH first, rising through 7.
Why isn’t the equivalence point always pH 7?
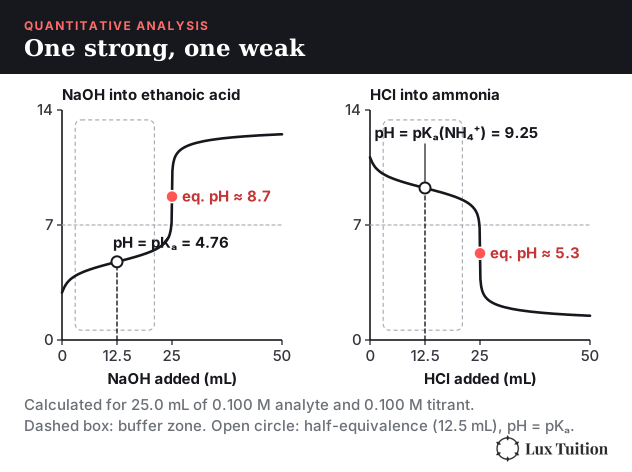
For any titration of a strong acid or base with a weak acid or base, the equivalence point is not at 7. It lies on the side of the strong substance: above 7 for a weak acid with a strong base, and below 7 for a weak base with a strong acid.
Take NaOH(aq) + ethanoic acid(aq) → sodium ethanoate(aq) + H2O(l). At the equivalence point all the OH− from the strong base has reacted, but the reaction has also formed ethanoate, the conjugate base of a weak acid. It is a weak base that reacts with water to form OH−:
ethanoate(aq) + H2O(l) ⇌ ethanoic acid(aq) + OH−(aq)
so the solution at equivalence is basic. The same thing happens when a strong acid neutralises a weak base: HCl(aq) + NH3(aq) → NH4Cl(aq), and NH4Cl is an acidic salt, so the solution at equivalence is acidic.
The flatter region before the jump is the buffer zone. Partway through the titration there are large amounts of both the weak substance and its conjugate, e.g. NH3 and NH4+, and that pair resists small changes in pH. Adding enough acid eventually overpowers it, and the pH falls sharply. A weak acid titrated with a weak base has almost no steep section, so the equivalence point can’t be pinpointed and the titration isn’t done directly.
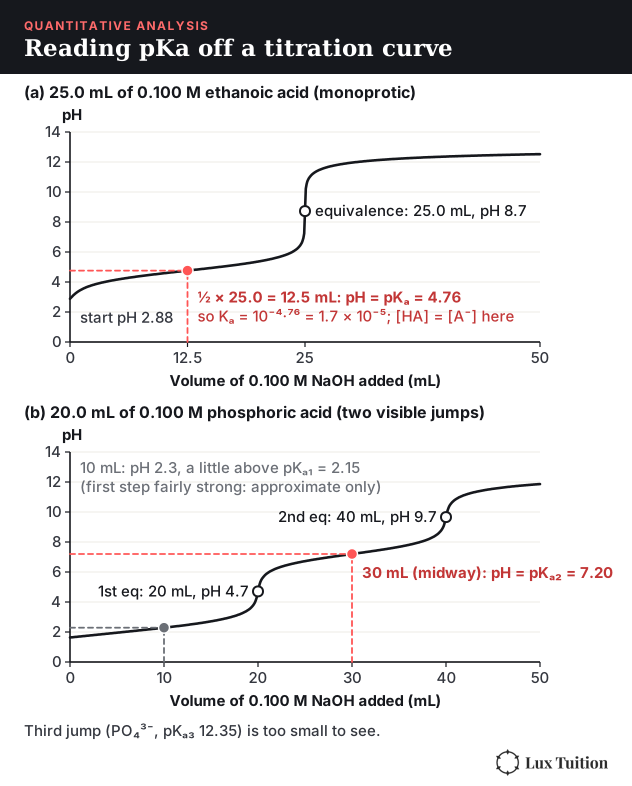
Half-equivalence point. When a weak acid is titrated with a strong base, halfway to the equivalence point exactly half the HA has been converted to A−, so [HA] = [A−]. These cancel in the Ka expression, leaving Ka = [H3O+], so pH = pKa at half-equivalence. Reading the pH at half the equivalence volume therefore gives the pKa, and so Ka, straight off the titration curve. A diprotic acid has two equivalence points: pKa1 is read at half the first equivalence volume, and pKa2 halfway between the first and second equivalence volumes (for equivalence points at 20 mL and 40 mL, at 30 mL). In 2024 HSC question 17, that point reads about pH 6.30. Module 6 Figure 32 shows both constructions on calculated curves.
How to choose an indicator
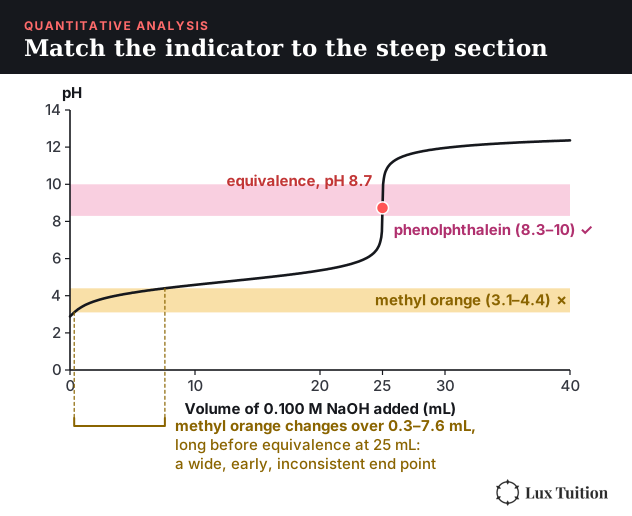
The indicator should change colour over a pH range as close to the equivalence point as possible:
- Strong acid + strong base (equivalence pH 7): bromothymol blue is ideal, but the steep section is so long that phenolphthalein and methyl orange also work.
- Weak acid + strong base (equivalence above 7): phenolphthalein.
- Strong acid + weak base (equivalence below 7): methyl orange.
Neutralisation can be modelled in several ways, and each shows something different: balanced and ionic equations show the particles that react, particle diagrams show how much of a weak acid is un-ionised, pH titration curves show where the equivalence point falls, and conductivity graphs show how the number and mobility of ions change. Computer simulations combine these views.
Conductometric titration
A solution’s electrical conductivity depends on the mobility and density of its charges: smaller, more mobile ions, higher temperature and more ions all increase conductivity. So 1 mol L−1 HCl conducts better than 1 mol L−1 ethanoic acid, because the strong acid fully ionises and releases more ions.
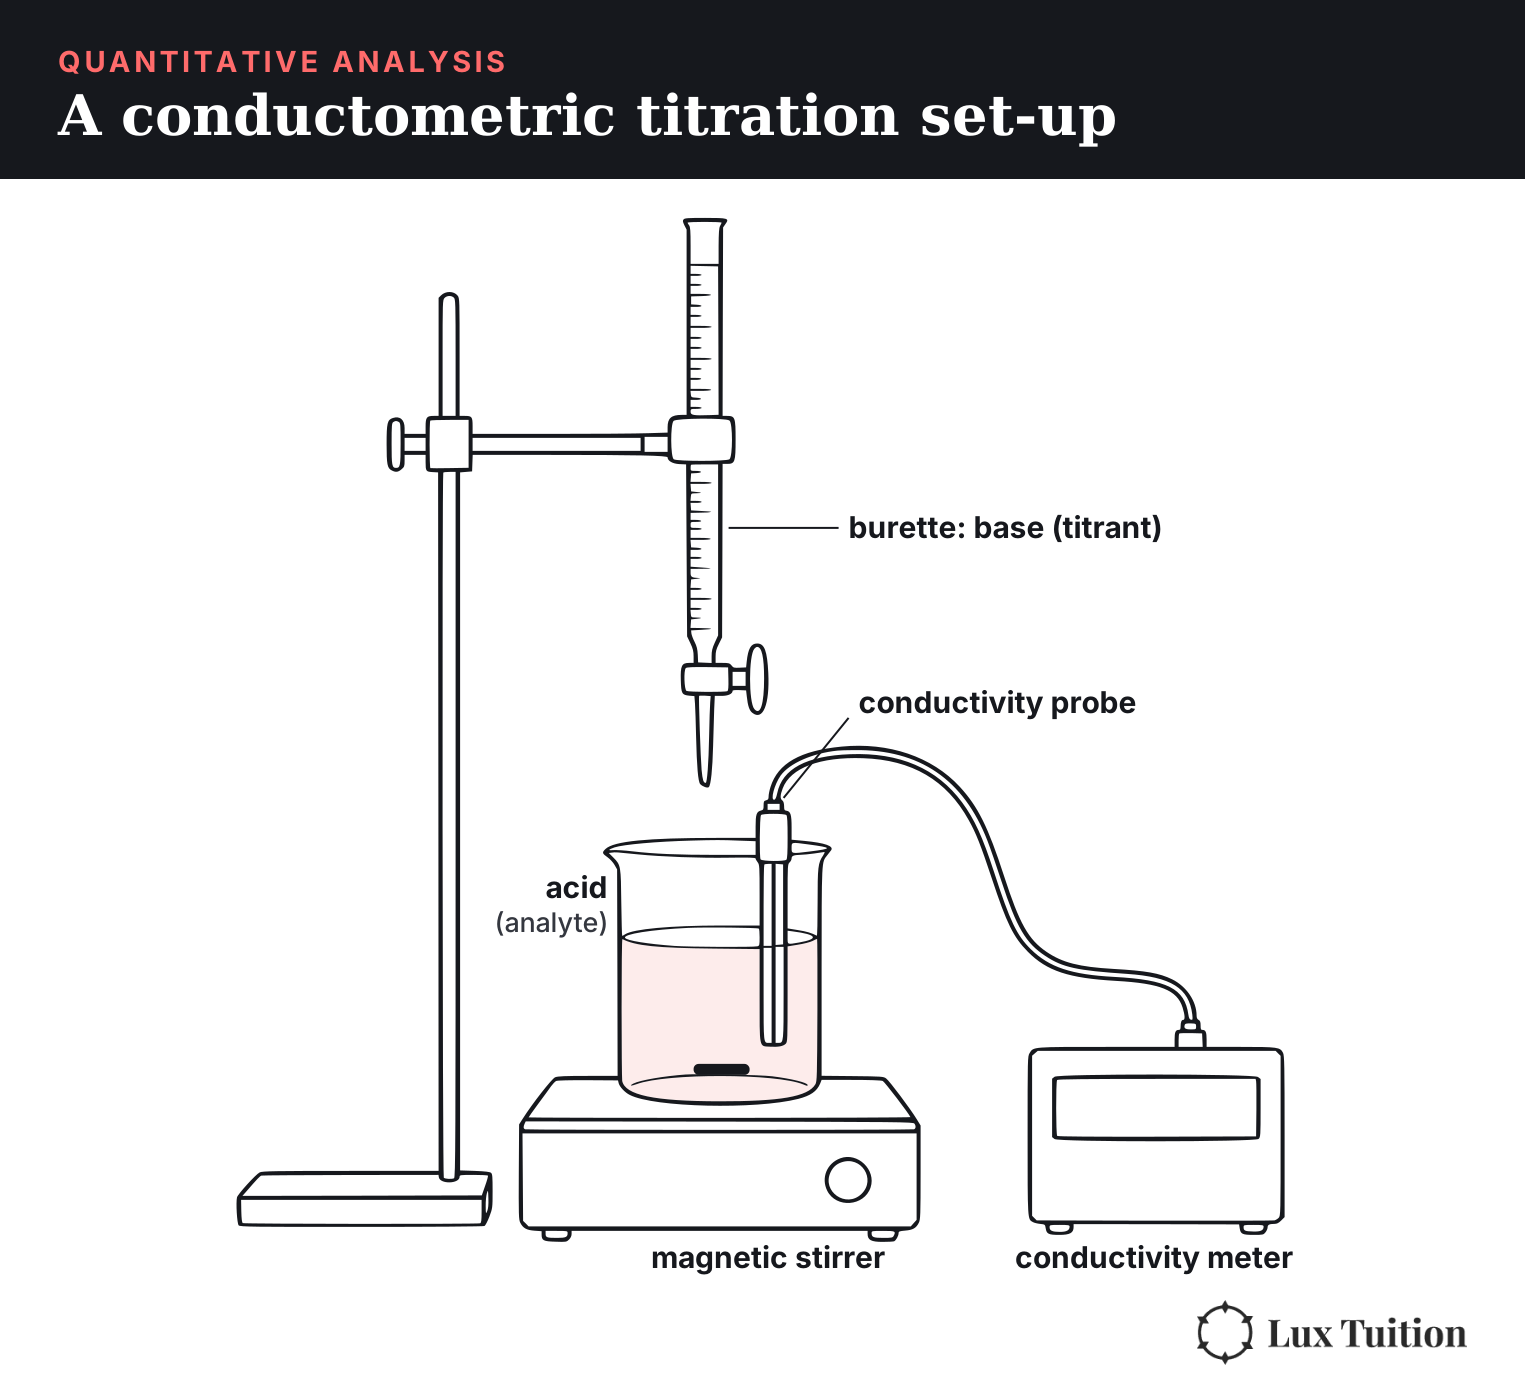
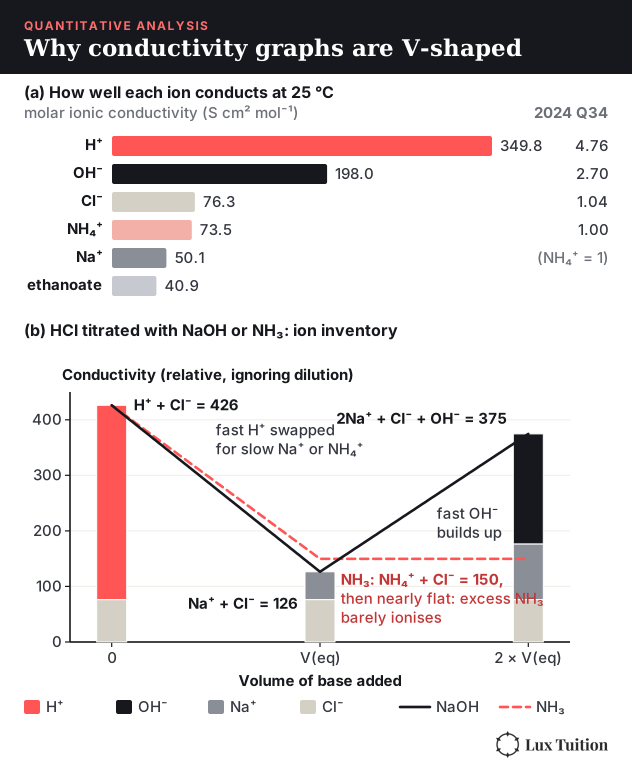
A conductometric titration monitors conductivity instead of pH. H+ and OH− conduct far better than other ions because they are much more mobile, so as they are neutralised into water, conductivity falls. Module 6 Figure 36 shows base being added to acid in four cases.
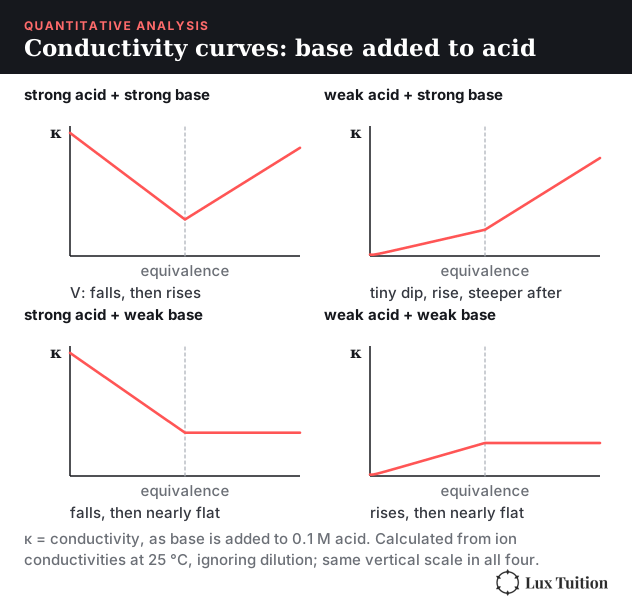
- Strong acid + strong base (HCl and NaOH): conductivity falls as H+ and OH− form water. At equivalence only H2O, Na+ and Cl− remain, so conductivity is lowest. Past it, excess OH− makes conductivity rise again.
- Weak acid + strong base (ethanoic acid and NaOH): a small initial dip as the few H+ ions are neutralised, then a gradual rise as the weak acid is converted into its conjugate ion, increasing the total number of ions. After equivalence the rise gets steeper because free OH− ions are being added.
- Strong acid + weak base (HCl and NH3): conductivity starts high and falls as H+ is replaced by NH4+. After equivalence it stays roughly flat, because excess NH3 barely ionises: the NH4+ already formed pushes NH3 + H2O ⇌ NH4+ + OH− to the left (Le Chatelier), so few extra ions appear. Experimentally it may rise slightly.
- Weak acid + weak base: rises as conjugate ions form, then levels off after equivalence.
The numbers behind these shapes are the ions’ molar conductivities (Module 6 Figure 37): H+ conducts about seven times better than Na+, and OH− about four times better. In 2024 HSC question 34 they were given relative to NH4+ = 1.00: H+ 4.76, OH− 2.70 and Cl− 1.04.
Conductometry works with very dilute, coloured or cloudy solutions, but any stray electrolyte distorts the curve and it can’t tell different ions apart.
Thermometric titration
A thermometric titration follows temperature instead of pH or conductivity. Neutralisation releases heat, so while the analyte is still being used up, each extra portion of titrant releases more heat and the temperature rises. Once the analyte has all reacted, more titrant releases no more heat, so the temperature levels off (or slowly falls). The turning point is the equivalence point. The total volume is kept the same in every mixture, so the same mass of solution is heated and the temperature rise reflects the heat released.
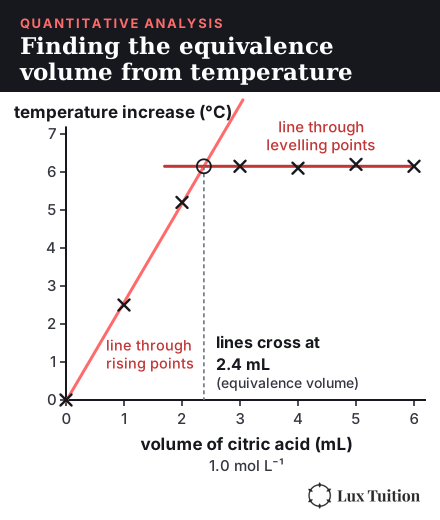
Worked example (2020 HSC question 25). Different volumes of 1.0 mol L−1 citric acid, a triprotic acid, were mixed with 8.0 mL of NaOH of unknown concentration and made up to 14.0 mL: C6H8O7 + 3NaOH → Na3C6H5O7 + 3H2O. The temperature increases were 0.00, 2.50, 5.20, 6.15, 6.10, 6.20 and 6.15 °C for 0.0, 1.0, 2.0, 3.0, 4.0, 5.0 and 6.0 mL of acid.
- Plot temperature increase (°C) on the vertical axis and volume of citric acid (mL) on the horizontal axis, with the quantity and unit on each axis label. Use an even scale that fills most of the grid and plot every point.
- Draw one best-fit line through the rising points and a second through the levelling points. Don’t join the dots, and don’t bend a line to reach a stray point.
- Read the volume where the two lines cross: about 2.4 mL.
- Use the mole ratio. n(citric acid) = 1.0 × 0.0024 = 2.4 × 10⁻³ mol, and the equation needs 3 mol of NaOH for each mole of citric acid, so n(NaOH) = 7.2 × 10⁻³ mol in 8.0 mL. c(NaOH) = 7.2 × 10⁻³ ÷ 0.0080 = 0.90 mol L−1.
What are Ka and pKa?
Ka, the acid dissociation constant, is the equilibrium constant for an acid ionising in water. For HA + H2O ⇌ A− + H3O+, Ka = [A−][H3O+] / [HA]. The larger Ka, the stronger the acid. As introduced under polyprotic acids, pKa = −log10(Ka), so as acid strength increases, pKa decreases. Bases have the equivalent Kb. For B + H2O ⇌ BH+ + OH−, Kb = [BH+][OH−] / [B], and pKb = −log10(Kb): the lower the pKb, the stronger the base.
For a conjugate acid–base pair, Ka × Kb = Kw, so at 25 °C pKa + pKb = 14. This is the mathematical form of the rule that the stronger the acid, the weaker its conjugate base: a large Ka forces a small Kb.
Percentage ionisation measures how much of a weak acid has ionised: % ionisation = [A−] at equilibrium ÷ initial [HA] × 100. Diluting a weak acid leaves Ka unchanged but increases its percentage ionisation. By Le Chatelier’s principle, adding water favours the side with more dissolved particles, which is the ion side (A− and H3O+). The pH still rises on dilution, because [H3O+] falls overall even though a larger fraction of the acid has ionised: 1 M ethanoic acid is 0.4% ionised but 0.001 M is 12% ionised (Module 6 Figure 21).
Linking to Gibbs energy. The Gibbs free energy equation is ΔG° = ΔH° − TΔS°, and the lower ΔG° is for ionisation, the further it goes and the stronger the acid. In the 2023 HSC data, both acetic and trichloroacetic acid have a negative ΔS°, so −TΔS° is a positive (unfavourable) term for each. The penalty for trichloroacetic acid is much smaller (−TΔS° = +1.7 kJ mol−1, against +27.3 kJ mol−1 for ethanoic acid), so its ΔG° is far less positive (+2.9 against +27.2 kJ mol−1). That matches its much lower pKa (0.51 against 4.76): it is the stronger acid. Module 6 Figure 40 draws both acids and compares the three terms.
Graphing pKa values. The halogens F, Cl, Br and I are categories, so a graph of the pKa values of the haloethanoic acids (fluoro-, chloro-, bromo- and iodoethanoic acid) is a column graph (heights 2.6, 2.9, 2.9 and 3.2 in the 2025 HSC question). A variable that takes any number, such as volume, gets a line graph. The full method is in the Working Scientifically skills section.
The small x approximation
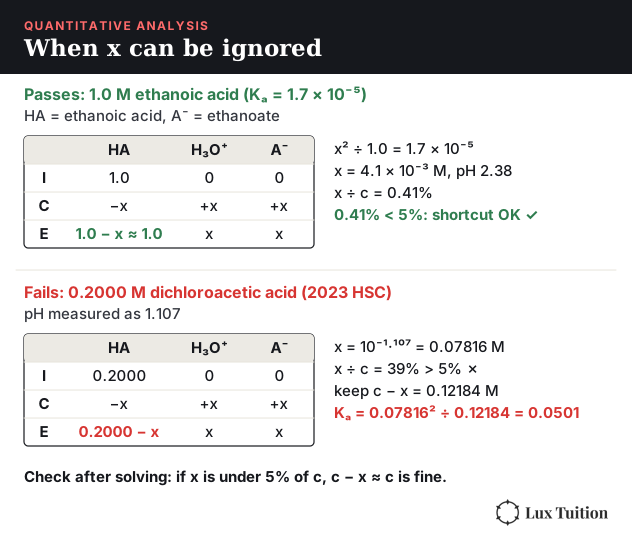
When an ICE table has a very small K (below about 10−4) and the starting concentration is much larger than K, x is so small that it barely changes the starting concentration, so we can say c − x ≈ c. This works for many weak acid questions, but check it after solving: if x is less than 5% of c, the shortcut is fine; if it is bigger, keep c − x in the expression. The 1.0 M acetic acid below passes (about 0.4% ionised). A 0.001 M solution of the same acid is about 12% ionised, so it fails. In the 2023 HSC question, 0.2000 mol L−1 dichloroacetic acid with a pH of 1.107 has x = 0.0782 mol L−1, which is 39% ionised, so the marking guideline keeps c − x = 0.1218 mol L−1 and finds Ka = 0.0501.
Example. Ka for acetic acid is 1.7 × 10⁻⁵. Find the pKa and the pH of a 1.0 M solution.
- pKa = −log(1.7 × 10⁻⁵) = 4.77
- ICE: [ethanoate] = [H3O+] = x, and [ethanoic acid] = 1.0 − x ≈ 1.0
- x2 / 1.0 = 1.7 × 10⁻⁵, so x = 4.12 × 10⁻³ M
- pH = −log(4.12 × 10⁻³) = 2.38
Working backwards. A 0.025 M propanoic acid solution has a pH of 3.24. Find Ka and pKa.
- [H3O+] = 10−3.24 = 5.75 × 10⁻⁴ M = [propanoate]
- Ka = (5.75 × 10⁻⁴)2 / (0.025 − 5.75 × 10⁻⁴) = 1.4 × 10⁻⁵
- pKa = 4.87
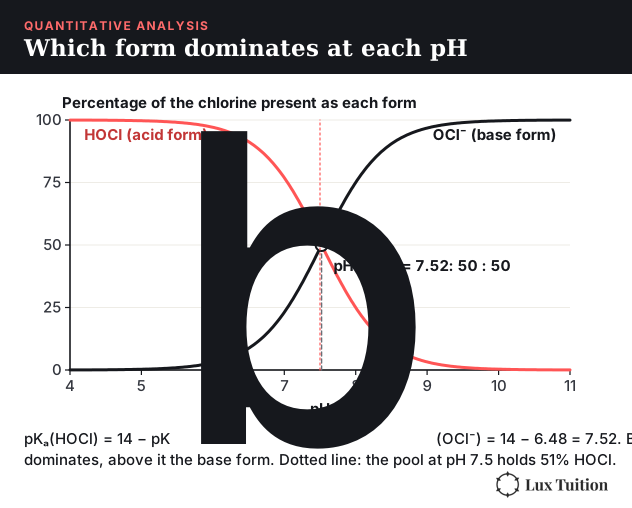
When something else holds the pH. If a buffer or other control keeps the pH fixed, don’t set [H+] = x. Take [H+] or [OH−] straight from the pH, put it in the equilibrium expression, solve for the other species, and add the acid and base forms to find the total that was added. In the 2022 HSC pool question, a pool is held at pH 7.5 by a different buffer and needs [HOCl] = 1.3 × 10⁻⁴ mol L−1. For OCl−(aq) + H2O(l) ⇌ HOCl(aq) + OH−(aq), K = 3.33 × 10⁻⁷.
- pOH = 14 − 7.5 = 6.5, so [OH−] = 10−6.5 = 3.16 × 10⁻⁷ mol L−1
- K = [HOCl][OH−] ÷ [OCl−], so [OCl−] = 3.16 × 10−7 × 1.3 × 10−4 ÷ 3.33 × 10−7 = 1.23 × 10⁻⁴ mol L−1
- Total chlorine = [HOCl] + [OCl−] = 1.3 × 10⁻⁴ + 1.23 × 10−4 = 2.53 × 10⁻⁴ mol L−1
- Dilution from 2.0 mol L−1 NaOCl into a 1.00 × 10⁴ L pool: V = 2.53 × 10−4 × 1.00 × 104 ÷ 2.0 ≈ 1.3 L
From Ka to Ksp. An acidic salt can involve acid ionisation and dissolving together. In the 2021 HSC question, a saturated solution of trimethylammonium chloride has a pH of 4.46, and the ion is a weak acid with Ka = 1.55 × 10⁻¹⁰. Use the pH and Ka to find how much salt is dissolved, then use the dissolving equilibrium (Ksp is in our Module 5 notes).
- [H3O+] = 10−4.46 = 3.47 × 10⁻⁵ mol L−1, and [trimethylamine] is the same
- Ka = [H3O+][trimethylamine] ÷ [trimethylammonium], so [trimethylammonium] = (3.47 × 10⁻⁵)2 ÷ 1.55 × 10⁻¹⁰ ≈ 7.76 mol L−1
- For 1:1 dissolving, Ksp = [trimethylammonium][Cl−] ≈ 7.76 × 7.76 ≈ 60.2
What are buffer solutions and how do they work?
Buffers resist small changes in pH.
They’re used wherever pH must stay within a narrow range, such as blood, swimming pools and medicine manufacture. A buffer works through Le Chatelier’s principle, in an equilibrium with high concentrations of both members of a conjugate acid–base pair:
ethanoic acid(aq) + H2O(l) ⇌ ethanoate(aq) + H3O+(aq)
If H+ ions (acid) are added, the equilibrium shifts left to use them up, with ethanoate absorbing them. If OH− ions (base) are added, they react with H3O+, and the equilibrium shifts right to replace it. Buffer capacity is the ability of a buffer to resist changes in pH: the higher the concentration of both species in the pair, the greater the capacity.
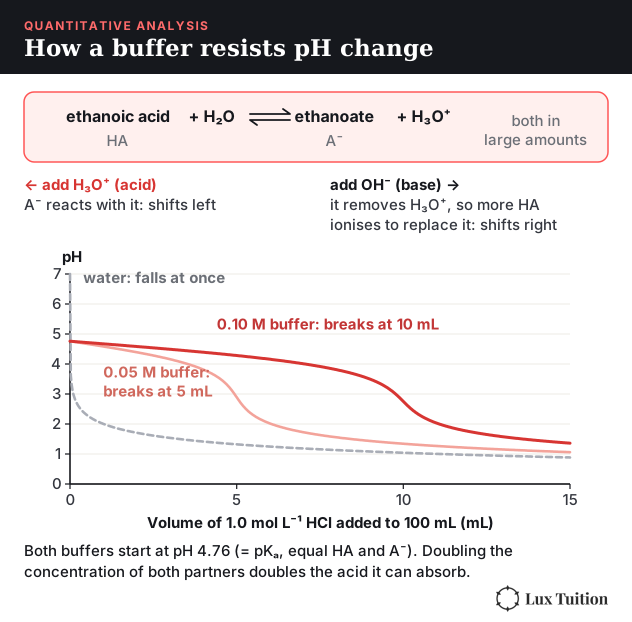
Making a buffer. Mix a weak acid with a salt of its conjugate base, such as ethanoic acid with sodium ethanoate. A weak base with a salt of its conjugate acid, such as NH3 with NH4Cl, gives a basic buffer. A third route is to half-neutralise a weak acid with NaOH, which converts half of it into its conjugate base. When the acid and its conjugate base are present in equal amounts, pH ≈ pKa, the same result as the half-equivalence point of a titration. Diluting a buffer barely changes its pH, because both partners are diluted equally and the ratio [A−]/[HA] stays the same, but its capacity drops because there is less of each to absorb added acid or base.
Demonstrating buffer properties. The demonstration compares a buffer with the same volume of water. Use fresh portions of the buffer and of the water for the acid test and for the base test, because adding acid and then base to the same sample would partly cancel the first change. Add a few drops of strong acid to one buffer portion and one water portion, a few drops of strong base to a second pair, and measure the pH each time. The pH of water changes by several units, while the pH of the buffer barely moves, until enough acid or base is added to use up one partner of the pair.
Illustrative recipe. Mix 50.0 mL of 0.100 mol L−1 ethanoic acid with 50.0 mL of 0.100 mol L−1 sodium ethanoate. The two partners are in equal amounts, so the pH should be close to the pKa, 4.76. Measure the initial pH of the buffer and of 100 mL of distilled water with a calibrated meter. Then run matched challenges, each on a fresh 40 mL portion: add 5 drops of 0.1 mol L−1 HCl to one buffer portion and one water portion, and 5 drops of 0.1 mol L−1 NaOH to a second pair. Stir, wait for a steady reading, and record each pH. Illustrative results: the water moves by several units (from near 7 to about 3 with acid, and to about 11 with base), while the buffer moves by about 0.01.
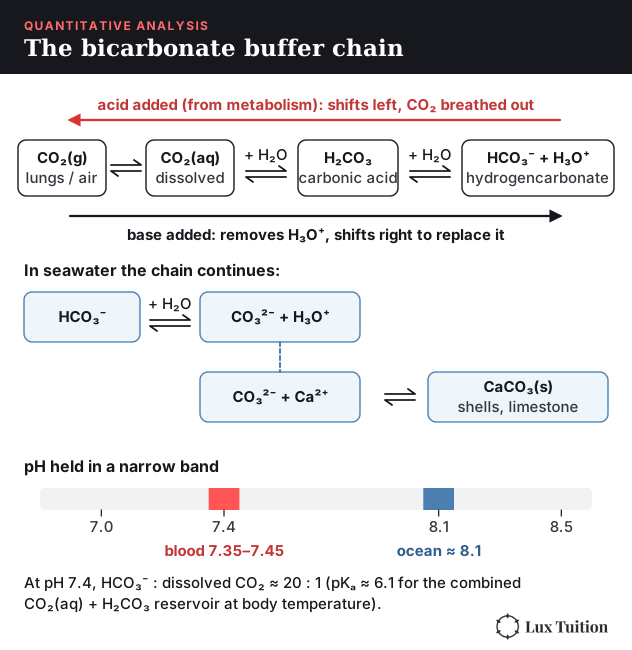
Natural buffers. Human blood must stay between pH 7.35 and 7.45 for cells to function, even though it carries many acids and bases that constantly fluctuate. It uses the bicarbonate buffer, carbonic acid and its conjugate base:
H2CO3(aq) + H2O(l) ⇌ HCO3−(aq) + H3O+(aq)
Carbonic acid comes from the carbon dioxide produced in cellular respiration reacting with water: CO2(aq) + H2O(l) ⇌ H2CO3(aq). Buffer systems are everywhere in nature: complex buffers in soil keep its pH suitable for plants, and ocean pH is held near 8 by a carbonate buffer involving carbonate from calcium carbonate rock and carbonic acid from dissolved atmospheric CO2.
Acid/base analysis in industry
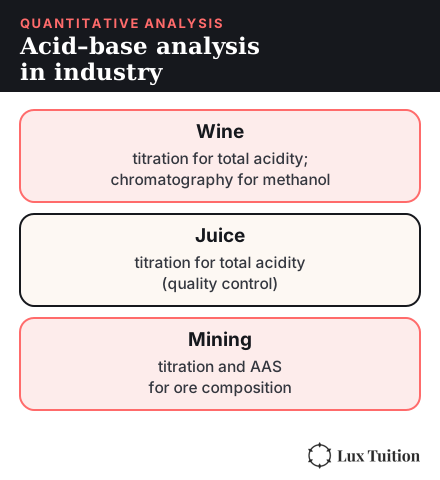
- Wine: fermentation produces a mixture of acids that affect taste, so acid–base titration is used in quality control to measure acidity. Chromatography identifies which acids are present, and gas chromatography measures ethanol and other alcohols, including toxic methanol, which must be kept to minimal levels.
- Juice: titration with NaOH measures the total titratable acidity of juice (mostly citric acid in orange juice), which is used for quality control and to judge taste. Vitamin C (ascorbic acid) is measured by a different, redox, titration, because every acid in the juice reacts with NaOH.
- Mining: ore composition is determined using methods including atomic absorption spectroscopy (AAS) and titration.
Acid/base knowledge of Aboriginal and Torres Strait Islander Peoples
Aboriginal peoples have used the chemical properties of native plants and minerals for food and medicine for thousands of years.
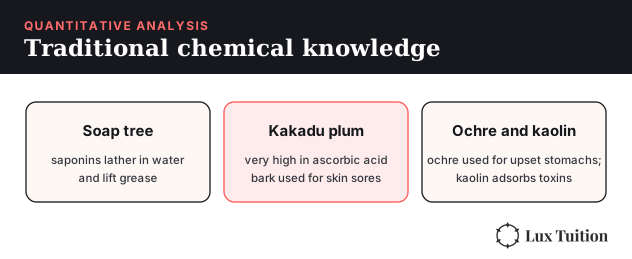
- Soap tree (Alphitonia excelsa) leaves form a lather when crushed and rubbed in water. They contain saponins, which, like soap, have a hydrophilic (water-loving) end and a hydrophobic (water-avoiding) end, so they lift grease and dirt into water to be washed away.
- Kakadu plum, found across northern Australia, has one of the highest vitamin C (ascorbic acid) contents of any fruit, many times that of oranges. Its bark has been used as a traditional medicine for skin sores.
- Clays and ochre have been used to treat stomach upsets. Yellow ochre contains hydrated iron oxide-hydroxide (FeO(OH)·nH2O), which has been described as acting like an antacid, and kaolin (white) clay can adsorb ingested toxins.
How was this knowledge developed? The syllabus describes Aboriginal and Torres Strait Islander Peoples developing and refining knowledge through observation, making predictions, testing (trial and error) and responding to environmental factors. For acids and bases, that framing means a plant or mineral was judged by what it did (its observable effects), predictions were made about how it would behave, and its use was tested and refined over time. Modern chemistry can then explain the effect, such as soap-like saponins or an antacid-like iron oxide-hydroxide, and the two kinds of knowledge are complementary. The example below describes publicly documented observations; consult community-authored or endorsed sources for further detail.
A sourced example. Pituri (Nicotiana) was chewed with wood ash. In a study of central Australian Aboriginal women’s knowledge and practices, the Pituri Learning Circle (Ratsch, Mason, Rive, Bogossian and Steadman, 2017, Rural and Remote Health 17: 4044), Janet Inyika described judging ash by taste and by how it mixed into the quid: ash with no taste was no good, and neither was ash that didn’t blend into the quid and irritated the nose. Only ash from a fire made for the purpose was used, such as burnt mulga twigs, white gum or bloodwood bark. The study also reports laboratory measurements, made separately, that the preferred ashes had a pH above 11.5, and that the leaf (pH about 5.5) reached about pH 10 to 12 once mixed with ash. Another source says the ash helps release nicotine from the leaf (Tobacco in Australia, Cancer Council Victoria, 2019). This is historical evidence of careful observation and testing of a basic material, and modern acid–base chemistry explains the result. It is not a classroom procedure: never taste chemicals in the laboratory.
Digital probes and instruments
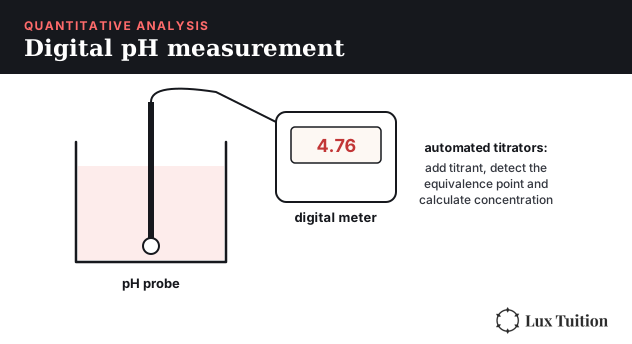
pH probes give a more precise digital pH reading than indicators. In labs that run large numbers of titrations, automated titrators add the titrant under computer control, detect the equivalence point from sensor data and calculate the analyte concentration from the titre volume.
Analysing a household substance applies the titration theory above to a real sample. An acidic product is titrated with a standardised base such as NaOH, and the indicator is chosen to suit the acid: the acids in vinegar, juice and wine are weak, like ethanoic and citric acid, so phenolphthalein suits their basic equivalence point. A concentrated sample such as vinegar is diluted first, so the titre is a sensible volume for the burette. Soft drink must have its dissolved CO2 removed first, by warming or stirring, because it forms carbonic acid that would add to the measured acidity. Strongly coloured samples like red wine hide an indicator’s colour change, so a pH meter is used to find the equivalence point instead. Results are often reported as % w/v, the grams of acid per 100 mL of the product. For a liquid like ethanol, volume is found from mass with V = m/ρ, and % v/v = 100 × solute volume ÷ sample volume. In 2021 HSC question 35, 20.02 mL of ethanol in a 25.0 mL sample gives 20.02/25.0 × 100 = 80.08% v/v, below the 85% requirement.
Worked example (illustrative numbers). Vinegar is analysed for ethanoic acid. 10.00 mL of vinegar is diluted to 250.0 mL in a volumetric flask, and a 25.00 mL aliquot needs a titre of 8.00 mL of 0.100 mol L−1 NaOH, with phenolphthalein as the indicator.
- n(NaOH) = 0.100 × 0.00800 = 8.00 × 10⁻⁴ mol, which equals n(ethanoic acid) in the aliquot (1:1)
- The aliquot is one-tenth of the diluted solution (25.00 ÷ 250.0), so the 10.00 mL of vinegar held 8.00 × 10−4 × 10 = 8.00 × 10⁻³ mol
- m = 8.00 × 10−3 × 60.05 = 0.480 g in 10.00 mL, which is 4.80 g per 100 mL, so the vinegar is 4.8% w/v
Working Scientifically skills for Module 6
These skills earn marks in every Module 6 question that gives you data, a method or a graph. Numbers marked illustrative are made up to show a method; the others come from the worked examples above or from HSC papers and marking guidelines.
Questions and hypotheses
A hypothesis is a testable statement about how one thing affects another. A comparative or directional statement counts (“a weaker acid gives a higher pH”); adding “because it ionises less” makes it stronger but isn’t required. A prediction says what you should observe if the hypothesis is right, and its range must match what you test.
- Hypothesis: at the same concentration, ethanoic acid gives a higher pH than hydrochloric acid, across 0.001 to 0.1 mol L−1.
- Prediction: at each concentration tested, the pH of ethanoic acid will be above the pH of HCl.
Modifying a hypothesis. A first idea such as “pH depends only on concentration” is contradicted by the data: 0.1 M HCl has a pH of 1, but 0.1 M ethanoic acid has a pH of about 2.9. First check the method (calibration, concentrations); if the result repeats, revise the hypothesis to “pH depends on concentration and on the fraction of the acid that ionises”. The 2020 HSC question 34 graph supports the revision: HCl gives a straight line on a log concentration axis, while the weak acid curves because its fraction ionised changes (Module 6 Figure 21 shows the same pattern for ethanoic acid).
Common mistake: giving a prediction with no testable link between the variables, or one that covers a wider range than you tested.
Variables, controls and replicates
- The independent variable (IV) is what you change; the dependent variable (DV) is what you measure; controlled variables are kept the same so only the IV can explain a difference.
- An experimental control is a comparison sample treated identically except for the factor being tested.
- Replicates are independent samples (for example, separately prepared solutions); repeats re-measure the same sample.
Example: comparing acid strength by pH. IV: which acid. DV: pH. Controlled: concentration, temperature, volume and the same calibrated meter. Distilled water measured the same way is the experimental control, giving a baseline. In a titration, titrating several aliquots from one flask repeats the technique; preparing a second standard solution as well tests the preparation (see titration technique).
Common mistake: calling the controlled variables “the control”.
Risks, ethics and materials
A risk assessment links hazard → possible harm → specific precaution. “Be careful” earns nothing.
| Hazard | Possible harm | Precaution |
|---|---|---|
| Concentrated acid or NaOH solution | Chemical burns to skin and eyes | Safety glasses and gloves, dilute solutions, rinse splashes with plenty of water |
| Pipetting a solution by mouth | Swallowing a corrosive solution | Use a pipette filler |
| Heating a soft drink to remove CO2 | Scalds from boiling over | Heat gently in a heat-proof beaker, using tongs |
Ethics includes the environment and honesty: neutralise acid or base waste before disposal, and report results as measured. Materials are chosen for a reason: KHP, not NaOH, as the primary standard, and a pH meter instead of an indicator for a coloured sample.
Accuracy, precision, validity and reliability
- Accuracy: how close a result is to the true value. Precision: how close repeated results are to each other.
- Validity: the investigation answers the question it claims to. Reliability: repeating it gives consistent results.
Example (2020 HSC question 28). Solid NaOH absorbs water, so a mass weighed out as NaOH is partly water. The solution is weaker than calculated and every titre is too large in the same direction, which hurts accuracy. The indicator also changed colour in the flat part of the titration curve. There, a large volume change gives little pH change, so judging the colour end point gives inconsistent titres (16.35, 10.10, 12.35 and 11.25 mL), which hurts precision and reliability. An indicator that changes within the steep region would fix this (Module 6 Figure 34). Validity matters too: titrating juice with NaOH measures total acidity, so it isn’t a valid way to find vitamin C.
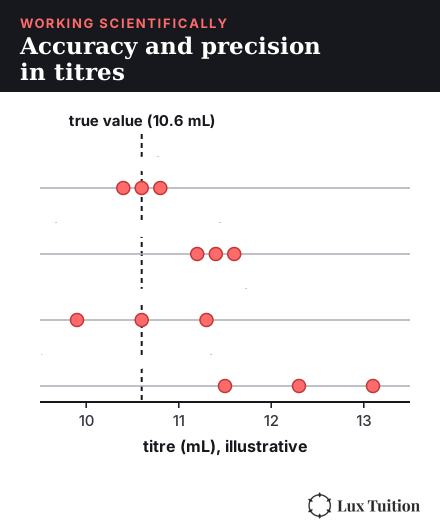
Calibration checks an instrument against a known standard: a pH meter is calibrated with buffers of known pH, and NaOH is standardised against KHP. Uncertainty is the doubt in a measurement (illustrative: each burette reading is ±0.05 mL and a titre is the difference between two readings, so the uncertainty adds to ±0.10 mL, which is 1% of a 10 mL titre). Random errors scatter results both ways, and averaging concordant titres reduces them. Systematic errors, such as wet NaOH, push every result the same way, so averaging can’t remove them; they need calibration or a corrected method.
Common mistake: writing “human error”. Name the specific error, say which way it moves the result, and say how to fix it.
Evaluating and improving an investigation
Name the weakness, say how it changes the result, then give a specific improvement.
- In the enthalpy of neutralisation practical, heat lost to the air makes the temperature rise smaller, so the measured ΔH is less negative than the true value. Use a lid, stir, and plot temperature against time to extrapolate back to the mixing time (Module 6 Figure 10).
- Peer feedback: swap a method or graph with a classmate, who checks it against clear criteria (axes labelled with units, controlled variables named, improvements specific) and gives one strength and one improvement. You decide which to act on and note why.
- In the 2022 HSC soft-drink method, gently heating removes CO2 that would form carbonic acid, and quantitative transfer (rinsing the beaker into the flask) stops acid being lost.
Data: tables and graphs
Choose the graph from the variable. Categories (F, Cl, Br, I) get a column graph; continuous variables (volume, concentration) get a line graph.
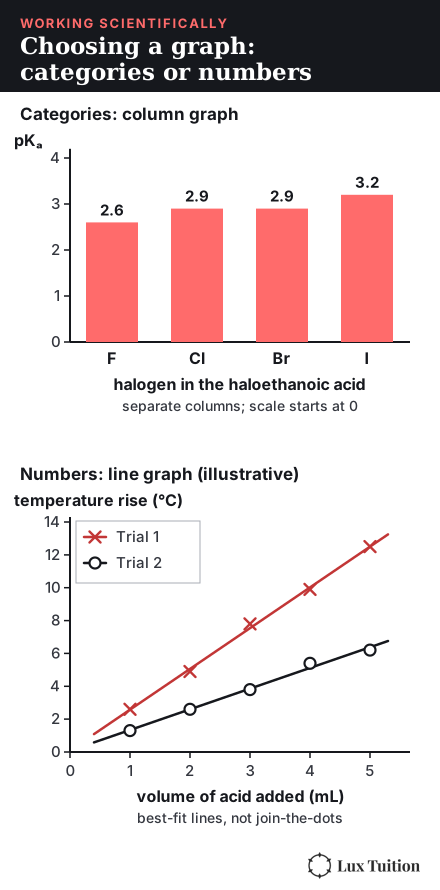
To construct a graph, as the 2020 question 25 and 2025 question 26(a) marking guidelines reward:
- Put the independent variable on the horizontal axis and the dependent variable on the vertical axis. Label each with the quantity and unit, such as volume of NaOH (mL).
- Choose an even scale that uses most of the grid. Column graphs start at zero.
- Plot every point accurately (a small cross), or draw each column to its exact height.
- If a graph shows two series, use different symbols and a key.
- For a trend, draw a line of best fit (straight or smooth) through the points rather than joining the dots. Two straight segments are right when the data change behaviour, as in the thermometric titration.
- A log axis, as in the 2020 question 34 graph, has equal gaps for tenfold changes.
Interpolation reads a value between measured points, which is fairly safe. Extrapolation extends beyond the data, which is risky: extending the rising line past 2.4 mL in the thermometric graph would predict ever-higher temperatures, but the data level off.
Common mistake: joining the dots with a ruler when asked for a trend, or leaving the unit off an axis.
Quantitative methods
Show working with units. Average only concordant titres (within about 0.1 mL, as above). In the 2022 HSC standardisation the guideline calculation uses 27.40 mL, which is also the mean of the last three titres (27.40, 27.20 and 27.60 mL); those span 0.40 mL, looser than the 0.1 mL rule, but the guideline left out the 28.60 mL titre as the clear outlier, so follow the question’s data and leave out an obvious outlier. Keep extra digits during working and round at the end. A pH has as many decimal places as [H+] has significant figures. Finally, check the answer makes sense: the pH of an acid is below 7, and a titre is a sensible burette volume. Worked methods are in pH calculations and titration calculations.
Models, secondary sources and evidence-based arguments
A model is a simplified version of reality that has limits: the particle diagrams exaggerate how many weak-acid molecules ionise, and the acid–base models figure shows what each model could not explain. A secondary source is data someone else collected. Ask what it measured, who produced it, and whether other sources agree; a claim that NaOH titration measures vitamin C fails because the method measures total acidity. Reference every source: author or organisation, title, date and web address, for example NSW Education Standards Authority, HSC Chemistry Marking Guidelines 2020. Data supplied in a question, like the 2023 table of ΔH°, ΔS° and ΔG°, are secondary data: quote the numbers.
An evidence-based argument has a claim, evidence and reasoning. Claim: trichloroacetic acid is stronger than acetic acid. Evidence: pKa 0.51 against 4.76, and ΔG° +2.9 against +27.2 kJ mol−1. Reasoning: its smaller entropy penalty makes ionisation more favourable (see the Gibbs energy link).
Command words
Treat these as guides; what a question needs depends on its wording and the data. The NESA glossary of key words gives the official meanings.
- Identify: recognise and name the answer.
- Outline: give the main features briefly, in general terms.
- Describe: give features, with values for a trend (“pH falls as concentration rises”).
- Explain: give a cause and effect, with equations if asked (2020 question 34).
- Analyse: break the data into parts and show trends and relationships with evidence.
- Discuss: give considerations and evidence, then reach a conclusion.
- Assess, evaluate: make a judgement, weighing strengths and limitations.
- Compare: give similarities and differences on the same features.
- Justify: support an answer with evidence from the question (2024 question 35).
- Calculate, construct: show working with units; draw the graph or model to specification.
HSC Chemistry Module 6 Revision Summary
What Comes After Module 6 in HSC Chemistry?
- Module 7: Organic Chemistry covers organic acids and bases, including carboxylic acids and amines, and uses esterification, an equilibrium that relies on an acid catalyst.
- Module 8: Applying Chemical Ideas returns to quantitative analysis, applying the back titrations introduced here to real samples alongside instrumental methods.
For the equilibrium background, go back to our HSC Chemistry Module 5 notes, and our Year 11 Chemistry notes cover the moles and concentration skills every titration calculation depends on. For the bigger picture, our ultimate guide to scoring Band 6 in Chemistry covers how to study the HSC course.
HSC Chemistry Tutoring in Blacktown
Module 6 is the most calculation-heavy module in HSC Chemistry, and marks go on small slips like forgetting the second OH− in Ba(OH)2. In our HSC Chemistry tutoring in Blacktown, theory is broken down by our tutors into the smallest possible parts and practised in classes of 1 to 5 students, a few minutes from Blacktown Station. Check our pricing page, or book a free trial with no obligations.
Frequently Asked Questions
What is Module 6 in HSC Chemistry?
Module 6 is Acid/Base Reactions, the second of four Year 12 modules in the NSW Chemistry Stage 6 Syllabus. It covers the properties and models of acids and bases, pH calculations using Brønsted–Lowry theory, and quantitative analysis including titration, titration curves, Ka and buffers.
What is the difference between the Arrhenius and Brønsted–Lowry models?
Arrhenius defines acids as substances that produce H⁺ in water and bases as substances that produce OH⁻ in water, so it only works for aqueous solutions. Brønsted–Lowry defines an acid as a proton donor and a base as a proton acceptor, which works outside water and explains conjugate pairs, amphiprotic species and why some salts are acidic or basic.
How do you calculate pH in HSC Chemistry?
Use pH = −log₁₀[H⁺]. For a strong acid, [H⁺] equals the acid concentration times the number of protons it releases. For a base, find pOH = −log₁₀[OH⁻], then pH = 14 − pOH at 25 °C. For a weak acid, use Ka and an ICE table to find [H⁺] first.
Why is the equivalence point not always at pH 7?
When a weak acid or weak base is titrated, the salt formed contains the conjugate of the weak substance, which reacts with water. Acetate from acetic acid makes the solution basic, and ammonium from ammonia makes it acidic, so the equivalence point shifts away from 7 towards the strong substance's side.
What is the difference between a strong acid and a concentrated acid?
Strength describes how completely an acid ionises in water, while concentration describes how many moles are dissolved per litre. A strong acid can be dilute and a weak acid can be concentrated. At the same concentration, a strong acid has a lower pH than a weak acid.
How does a buffer solution work?
A buffer contains high concentrations of both a weak acid and its conjugate base, such as H₂CO₃ and HCO₃⁻ in blood. Added H⁺ is absorbed by the conjugate base and added OH⁻ is neutralised by the weak acid, so by Le Chatelier's principle the equilibrium shifts to keep the pH almost constant.
Learn it properly with a specialist tutor at Blacktown or online across NSW. Enquire about a free trial — no cost, no obligation. See online formats and class sizes.
Realistic study tips to help you prepare better for assessments with less stress, plus a printable study planner