

These HSC Biology Module 7 notes cover Infectious Disease in the NSW Year 12 course, starting each idea from the basics with labelled diagrams.
Part of our HSC Biology notes. These notes follow the Biology Stage 6 Syllabus (2017) for the 2026 and 2027 HSC. The new syllabus is first examined in 2028.
The Working Scientifically skills at the end cover investigation design, data and evidence. The HSC Biology past-papers guide provides official papers and marking guidelines.
Key Takeaways
- Exposure (contact), infection (the cause gets in and multiplies) and disease (the body is harmed) are different things.
- Disease-causing agents range from worms you can see to particles far too small to see, and each type spreads in its own way.
- Spread needs a source, a route and a person, animal or plant that can be infected; breaking any link stops it.
- Plants and animals first block entry, then respond once an invader gets in.
- The body’s specific defences remember one particular invader, so they can prevent disease or make a later infection with the same one milder. This is why vaccination (a safe preview of an invader) works.
- Judge every control or treatment by its intended effect, using fair comparisons and the right data.
Start here: the words this module is built on
A pathogen is a living thing, or a particle, that can cause disease. An infectious disease is a disease caused when a pathogen gets into a host: the person, animal or plant it lives in or on. Many infectious diseases then pass from host to host, but not all of them do.
Follow one chain for any disease: the cause, how it reaches a new host, what it does inside, how the host fights back, and which action breaks the chain.
Learn these basic words first.
- A molecule is a group of atoms joined together, such as water or sugar.
- A cell is the smallest living unit. Most human cells have a thin outer cell membrane, a watery inside called cytoplasm, and a nucleus that holds the cell’s DNA (its instructions, explained next). (Mature red blood cells are an exception: they have no nucleus.)
- A protein is a large molecule built by the cell using its genes (below). Proteins do most of the work in a cell. Ribosomes are the tiny structures that build proteins: they join amino acids (small building-block molecules) into chains called polypeptides, which fold into proteins. Mitochondria release energy from food.
- DNA is the molecule that stores a living thing’s instructions. A gene is a section of DNA that carries the instructions for one protein. RNA is a similar molecule that cells use to copy and carry those instructions.
- An enzyme is a protein that speeds up one particular chemical reaction.
- A tissue is a group of similar cells working together, such as skin or muscle.
- A microbe (or microorganism) is a living thing too small to see without a microscope, such as a bacterium. Many microbes are harmless or useful; only some are pathogens.
- The immune system is the body’s set of defence cells, tissues and molecules. White blood cells are its cells.
- An antigen is a molecule that the immune system can recognise as a specific target, such as a marker molecule on a pathogen’s surface.
- An immune response is the body’s reaction to something it recognises as foreign or dangerous. It aims to remove it.
- A susceptible host is one that can be infected.
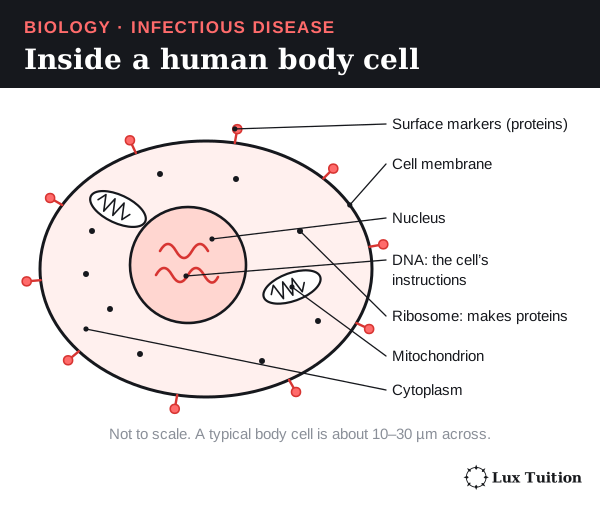
Three words describe what happens after contact with a pathogen:
- Exposure: coming into contact with the pathogen.
- Infection: the pathogen gets in and becomes established, usually by multiplying.
- Disease: the host’s normal functioning is harmed, often with signs such as fever.
An exposed person is not always infected. An infected person is not always sick: an infection with no symptoms is asymptomatic.
A treatment can cure one sick person without stopping spread. A measure that blocks spread, such as clean water, can protect people who never get sick at all.
How are diseases transmitted?
Which pathogens cause infectious diseases in plants and animals?
classifying different pathogens that cause disease in plants and animals (ACSBL117)
investigating the transmission of a disease during an epidemic
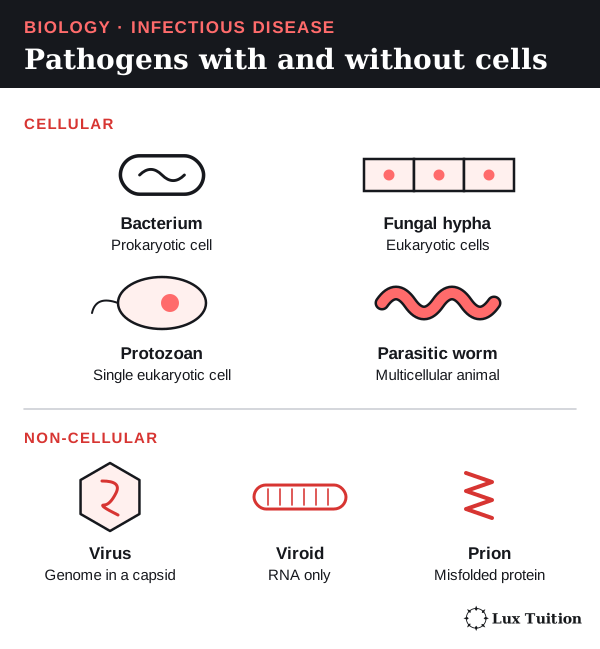
The syllabus sorts pathogens into three groups:
- Microorganisms: living things too small to see without a microscope. Most are single cells, but some microscopic fungi are many-celled. Examples: bacteria, protozoa and many fungi.
- Macroorganisms: many-celled animals big enough to see, at least as adults. A parasitic worm is still a macroorganism even though its eggs and larvae are microscopic. Examples: parasitic worms, ticks and mites.
- Non-cellular pathogens: agents that are not cells at all. Examples: viruses, viroids and prions.
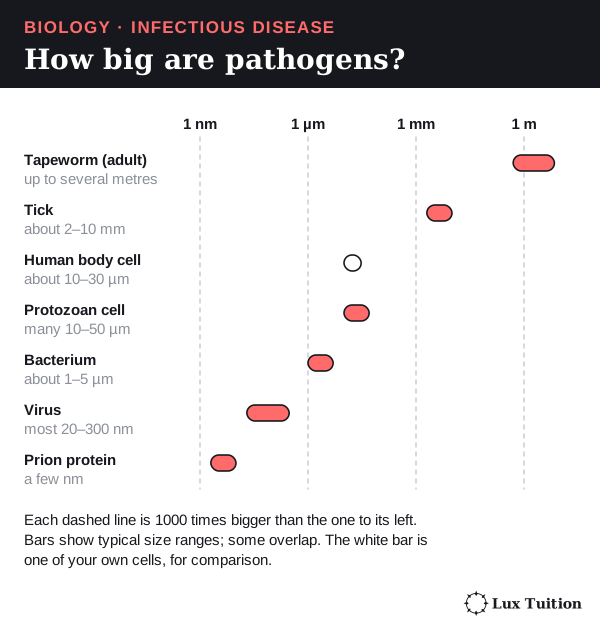
Bacteria
A bacterium is a single cell with no nucleus. Its DNA sits loose in the cytoplasm, usually as one large loop. Cells like this are prokaryotic; cells with a nucleus, like ours, are eukaryotic.
A bacterium has a membrane and ribosomes, and most have a tough cell wall outside the membrane. Many also carry small extra DNA loops called plasmids. Bacteria multiply by binary fission: one cell copies its DNA and splits in two.
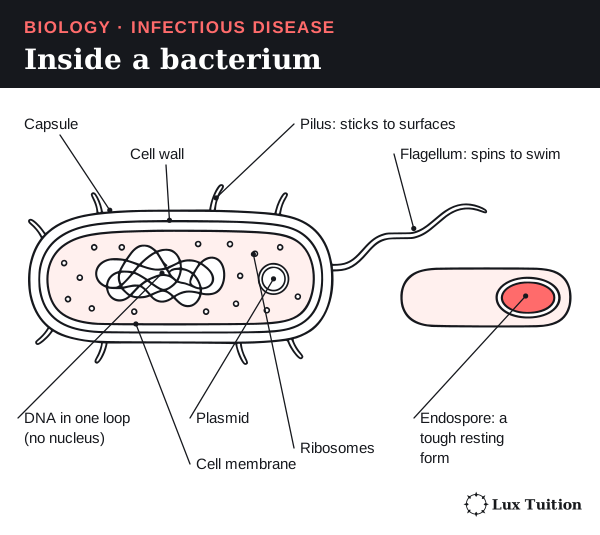
Some bacteria, such as the one that causes tetanus, form an endospore: a tough resting form that survives heat and drying. It helps the bacterium survive; it does not increase cell numbers. Tetanus is caught when endospores from soil enter a wound, not from another person.
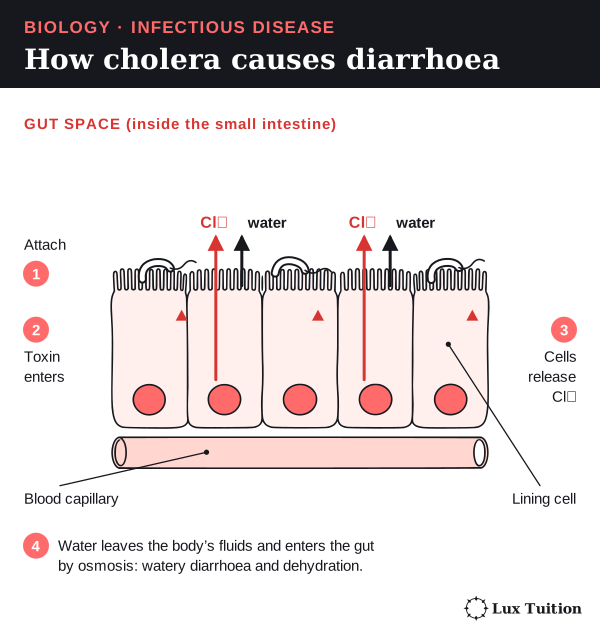
Example: cholera. Toxigenic strains of the bacterium Vibrio cholerae are swallowed in food or water contaminated with faeces. It attaches to the lining of the small intestine and releases a toxin (a harmful protein).
- The toxin enters the cells lining the small intestine.
- These cells pump chloride ions (electrically charged particles, written Cl⁻) out into the gut.
- Water follows by osmosis: water moves across a membrane towards where dissolved particles are more concentrated.
- The gut fills with water. Watery diarrhoea follows, and the person can become dangerously dehydrated.
Viruses
A virus is not a cell. It is genetic material (DNA or RNA) inside a protein coat called a capsid. Some also have an outer envelope, a fatty layer taken from the last host cell. A virus has no ribosomes and no metabolism (chemical reactions of its own), so it multiplies only inside a living host cell. A virus’s full set of genes is its genome.
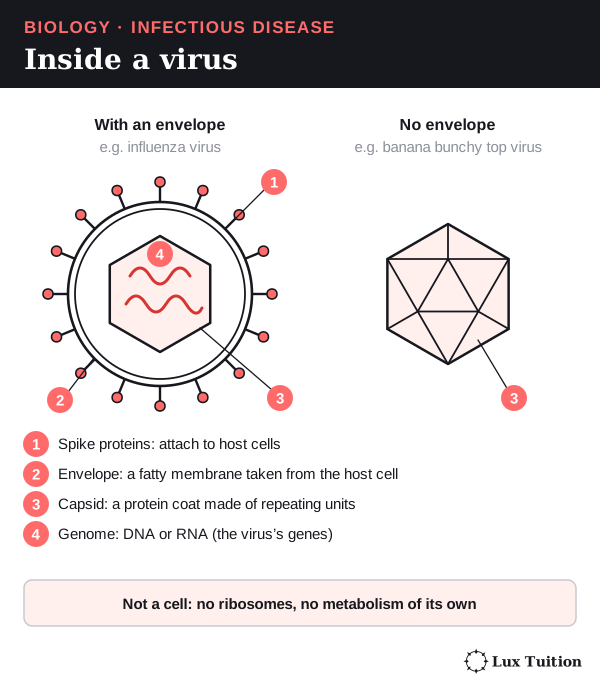
A virus multiplies in five steps:
- Attach. Viral proteins bind matching receptors (proteins on the host cell surface). This is why each virus infects only certain hosts and tissues.
- Enter. The virus, or just its genome, gets into the cell.
- Copy. The genome is copied using the cell’s materials.
- Make proteins. The host’s ribosomes build viral proteins.
- Assemble and leave. New viruses form and leave by budding (pushing out through the membrane) or lysis (bursting the cell).
Some viruses insert their DNA into the host’s DNA, but not all. An antibiotic is a drug that kills or stops bacteria. Antibiotics target bacterial walls or ribosomes, which viruses lack, so they do not stop viruses.
Examples: influenza viruses multiply in cells lining the airways; banana bunchy top virus stunts banana plants. Depending on the virus, spread can be by breathed-out particles, body fluids, vectors (living carriers such as insects) or infected plant material.
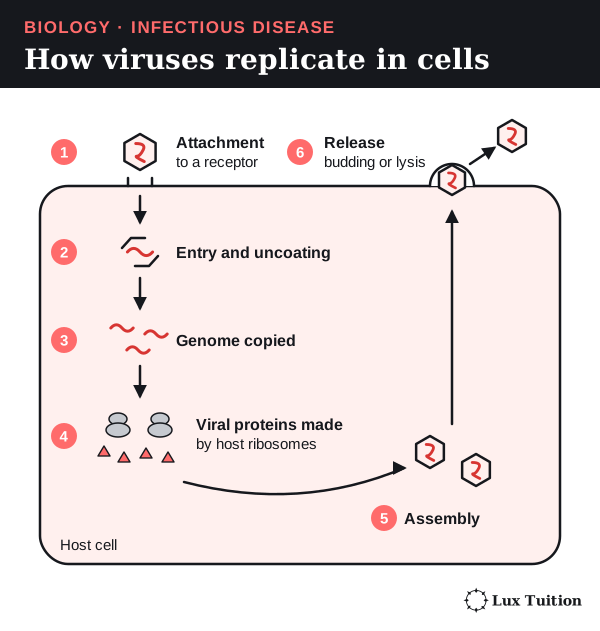
Worked example: how rabies copies its RNA. This has appeared in HSC exams.
Rabies carries negative-sense RNA. Its bases pair with (are complementary to) the message, rather than spelling the message itself, so ribosomes cannot read it directly. The virus therefore brings its own enzyme: an RNA-dependent RNA polymerase, which builds RNA using RNA as a template (a strand that is copied). It is made of a catalytic (speeds up the reaction) L protein and its P cofactor (a helper that the L protein needs).
In the host cell’s cytoplasm, the polymerase uses the genome in two ways:
- To make proteins. It copies the genome into short positive-sense mRNAs (messenger RNAs that ribosomes can read). Host ribosomes translate these into viral proteins, including new L and P.
- To copy the genome. It makes one full-length positive-sense copy, the antigenome, which is the template for many new negative-sense genomes.
Newly made L and P proteins join in, so RNA copying speeds up. New genomes are packed with viral proteins into new viruses. Remember: the polymerase makes RNA; ribosomes make protein.
This is RNA to RNA. It is not reverse transcription (copying RNA into DNA), and not every virus works this way. Rabies polymerase and replication, Nevers and colleagues, 2022.
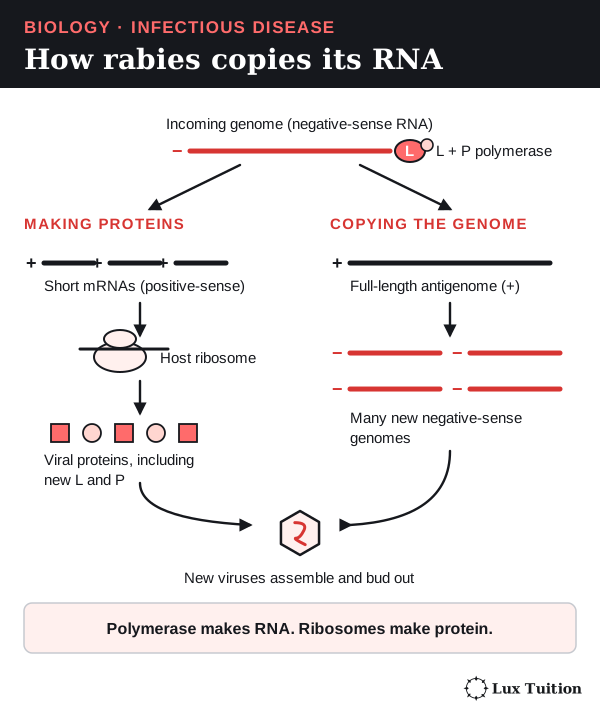
Fungi and water moulds
A fungus is a eukaryote. Its cell walls contain chitin, a tough material also found in insect shells. Many fungi grow as branching threads called hyphae; a mass of hyphae is a mycelium. Fungi make spores, tiny cells that spread by wind or water and grow into new fungi.
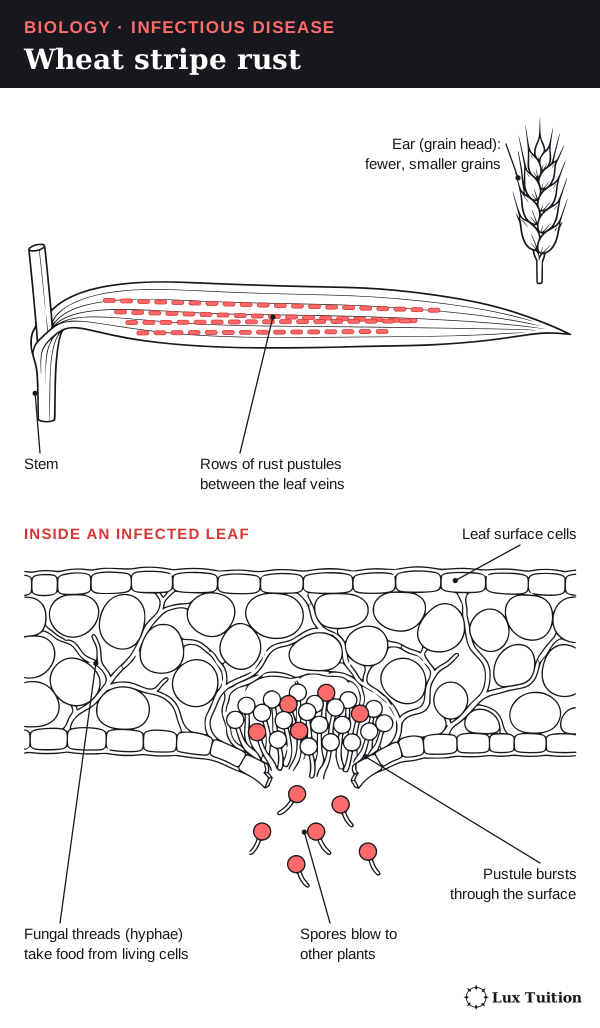
Example: wheat stripe rust, caused by Puccinia striiformis, damages wheat leaves. Its spores blow from plant to plant.
An oomycete (a eukaryotic water mould) looks like a fungus but belongs to a different group. Many make swimming spores called zoospores. Example: Phytophthora cinnamomi rots the roots of many Australian plants, so they cannot take up water and die back. It moves in contaminated soil, water and equipment.
Protozoa
A protozoan is a single eukaryotic cell that lives like a tiny animal. Many are parasites: organisms that live in or on a host and harm it.
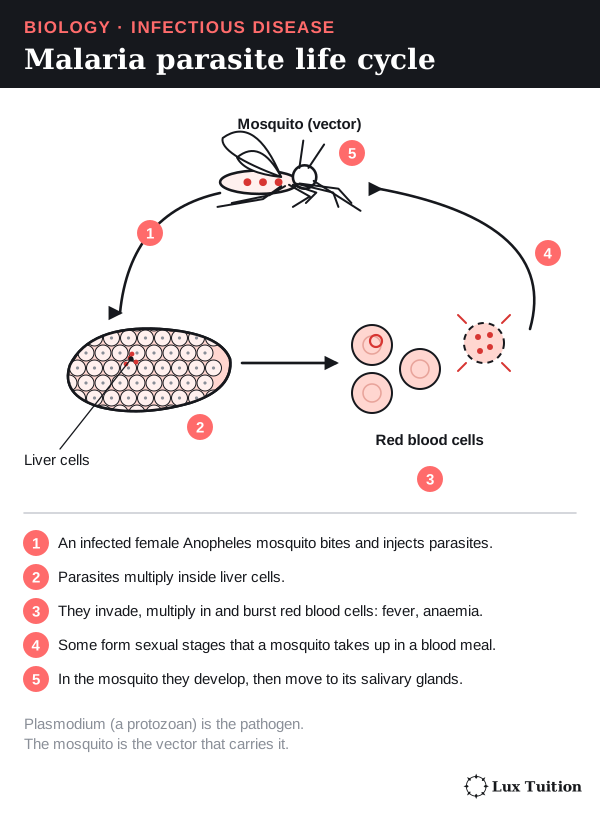
Example: Plasmodium species cause malaria. In people the parasite multiplies first in liver cells, then in red blood cells. An infected female Anopheles mosquito carries it between people. The mosquito is the vector (the living carrier), not the pathogen.
Macroparasites: worms, ticks and mites
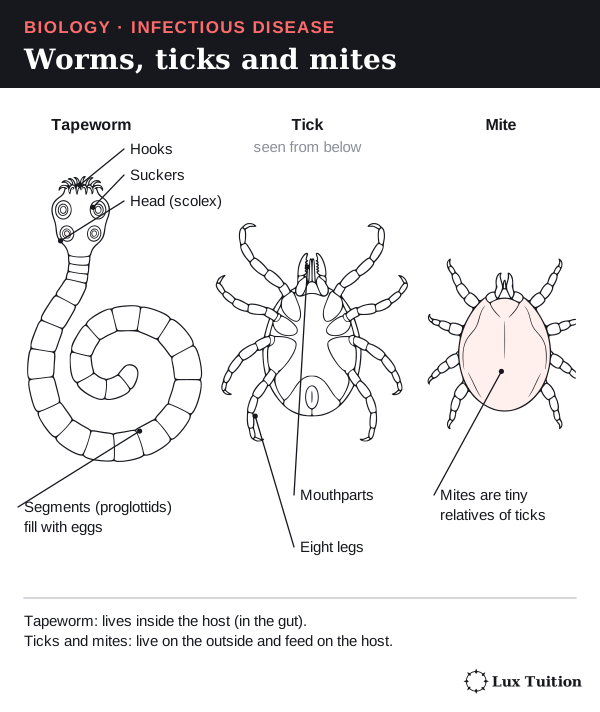
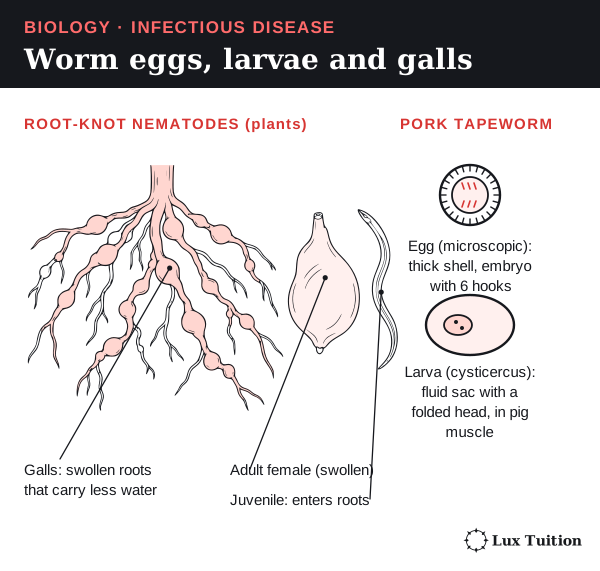
A helminth is a parasitic worm: a many-celled animal. Adult worms can often be seen, but their eggs and larvae (young stages) are microscopic. A tapeworm lives in the gut and absorbs its host’s digested food. How worms spread depends on the species and life stage: for example, swallowing eggs or larvae, or entering from soil. Root-knot nematodes are tiny worms that swell plant roots into lumps called galls, so the roots carry less water.
An ectoparasite lives on the outside of its host. Ticks and mites are arthropods (animals with jointed legs and a hard outer skeleton). Mites can damage skin as they feed. Some ticks and mites also carry a second pathogen, so separate the damage they do from their role as a vector.
Prions and viroids
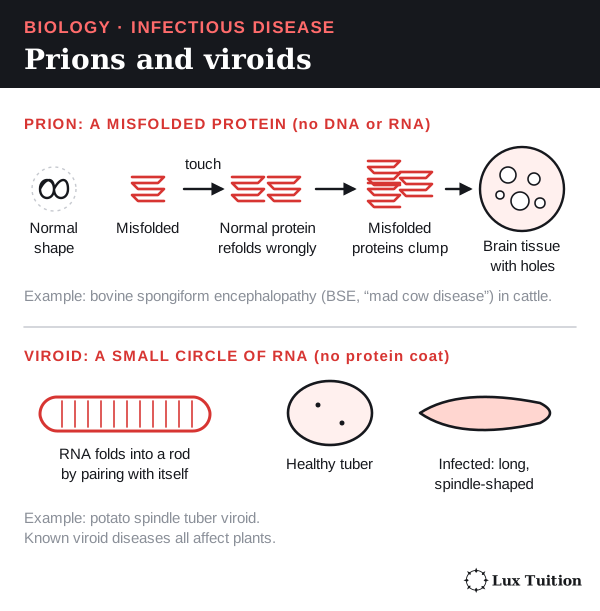
A prion is an infectious misfolded (wrongly shaped) protein with no DNA or RNA. When it touches a normal copy of that protein, the normal one misfolds too. The misfolded proteins clump and damage nerve tissue.
Example: bovine spongiform encephalopathy (BSE) in cattle. An epidemic is a rise in cases well above the number normally expected in a population and period; the BSE epidemic was spread by feed made from infected animals. Prions are not bacteria or viruses.
A viroid is a small loop of RNA with no protein coat. Viroids are only known to cause disease in plants. Example: potato spindle tuber viroid makes potatoes long and spindle-shaped. It spreads on infected planting material and tools.
Two more distinctions:
- An opportunistic pathogen usually causes disease only when defences are weak, or when it reaches a body part where it does not normally live.
- An immune response does not always mean infection: some harmless substances, for example pollen or food antigens, can trigger one. OpenStax: characteristics of infectious disease.
What can microbial testing of water and food establish?
Designing a fair test
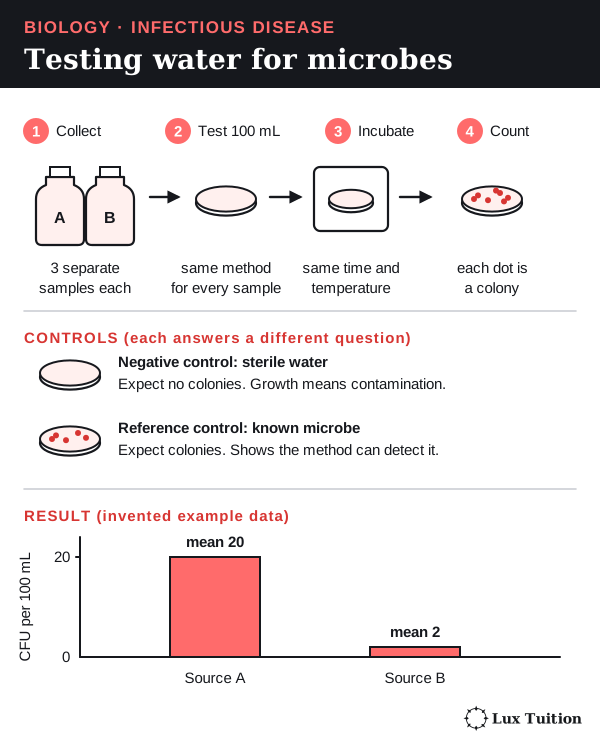
A microbial test answers one clear question. For example: do water samples from two sources contain different amounts of an indicator organism? This is a microbe whose presence warns that water may be contaminated, for example with faeces.
- The explanatory variable (what you compare) is the water source.
- The response variable (what you measure) is the amount of indicator.
Keep everything else the same:
- Test equal volumes with the same validated (proven) method.
- Record how each sample was collected, stored and transported.
- Take several independent samples from each source to show natural variation (see replication in the skills section).
- Calibrate equipment (check it against a known standard), time each step the same way, and label and log every sample.
Controls check the method. Each answers a different question, and none replaces repetition:
- A negative control (such as sterile water) should grow nothing. Growth suggests procedural contamination; investigate and recollect or retest.
- A reference control (a known sample of the target) should grow. It shows the method can detect the target.
Results are counted as colony-forming units (CFU), explained below. See investigation design and data quality.
Reading the results
Plate results are often reported as colony-forming units (CFU). A colony is a visible spot of growth; one colony may start from a clump of cells. Microbes that cannot grow in the chosen conditions are missed.
A molecular test detects DNA or RNA, which does not prove the microbe was alive. A positive indicator does not identify every pathogen, and a negative result does not prove water is safe. US EPA: drinking-water indicators.
Worked example (invented data). Three independent samples give 18, 22 and 20 CFU per 100 mL from source A, and 2, 1 and 3 from source B.
- Mean for A: (18 + 22 + 20) ÷ 3 = 20 CFU per 100 mL.
- Mean for B: (2 + 1 + 3) ÷ 3 = 2 CFU per 100 mL.
Source A has ten times more of this indicator, measured this way. That does not show ten times more pathogens, which species are present, or what caused anyone’s illness.
Antimicrobial tests: zones of inhibition
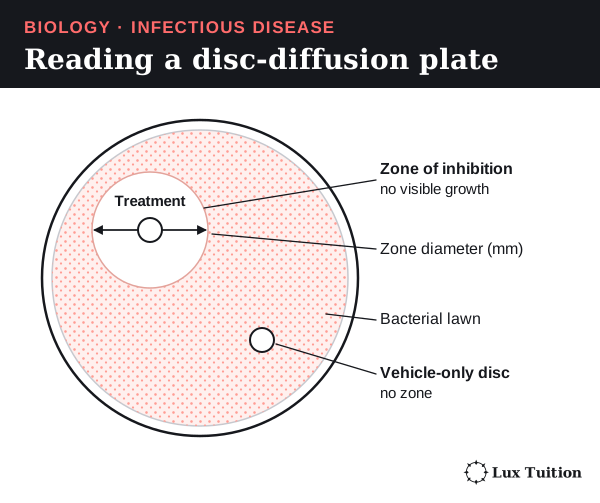
An antimicrobial kills or slows microbes. In disc diffusion, a paper disc soaked in the substance sits on a plate covered with bacteria. The substance spreads out, and a clear ring with no visible growth forms: the zone of inhibition. A clear zone does not prove every bacterium there died.
Measured the same way, zone diameters compare treatments within one standard test. If two different bacteria are involved, a substance needs to work against both.
Testing honey fairly.
- Treatment group: bacteria exposed to honey.
- Comparison group: bacteria with the same carrier liquid but no honey. This shows whether honey causes the effect.
- Uninoculated control (no bacteria): checks contamination. It cannot replace the comparison group.
Keep the strain (a genetic type of bacterium), growth medium (the nutrient agar, a jelly the bacteria grow on) and dose the same; the full design is in the skills section. Substances spread through agar at different rates, so zone size alone cannot rank drugs for patients; interpretation uses drug- and organism-specific criteria. EUCAST: disk diffusion and quality control.
Working safely and ethically
School microbe work needs teacher-approved methods, a risk assessment, sealed containers and approved disposal. Never open unknown plates. Published data helps interpretation but does not replace doing the practical. Outbreak research must protect health information and never deliberately infect anyone.
A good report states the source, method, units, controls and uncertainty (how far results could be off), and acknowledges sources properly; see secondary sources.
Exam focus: bacterium or virus?
After a flood, people get gastroenteritis (vomiting and diarrhoea). A lab tests their samples with two targeted molecular tests: one for Salmonella DNA (a bacterium) and one for norovirus RNA (a virus). The RNA test first uses reverse transcription to copy the RNA into DNA, which is then amplified (multiplied for detection).
A positive result for one target is direct evidence for that agent. This is far stronger than finding that nothing grows on agar.
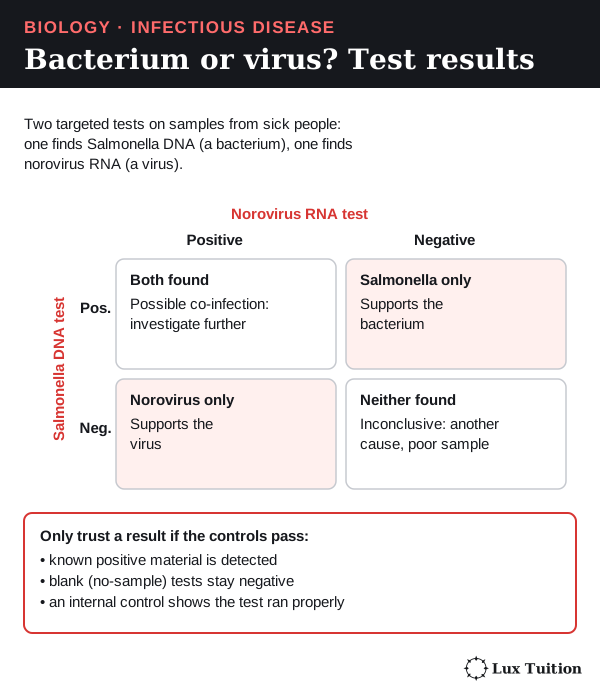
The controls:
- Known positive material shows each test can detect its target.
- A negative extraction control and a no-template control (no sample added) check for contamination.
- An internal control shows the sample was processed properly and nothing blocked the test.
With controls passing:
- Norovirus only: supports norovirus.
- Salmonella only: supports Salmonella.
- Both: possible co-detection; investigate further.
- Neither: inconclusive (another agent, a poor sample or too little target).
Blaming the outbreak on one agent also needs matching results across cases and exposure evidence. Results should be reproducible, and a test proven for stool must not be assumed to work for floodwater. FDA gastrointestinal molecular-assay evaluation.
Seeing or growing bacteria adds evidence, but light microscopes cannot show most viruses. No growth may mean wrong conditions; a failed antibiotic may mean the bacteria resist it. Neither proves a virus. A test can also give a false positive from a similar target, so surprising results need confirming with a different validated target or method.
How do direct, indirect and vector transmission differ?
Transmission is how a pathogen gets from a source to a new susceptible host.
- A reservoir is where the pathogen normally lives in nature, such as an animal population, soil or water.
- A fomite is a non-living object, such as a cup, that carries the pathogen for a short time. It is a vehicle, not a home where the pathogen multiplies.
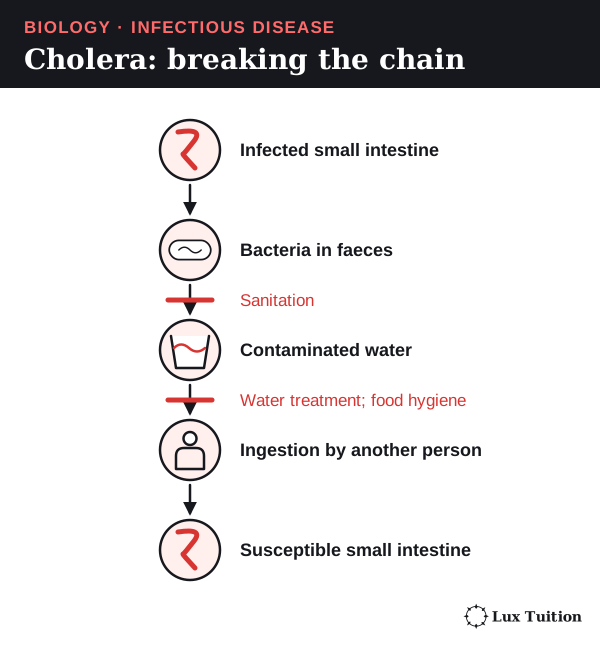
Following the chain: cholera
- Bacteria multiply in an infected person’s intestine.
- They leave the body in faeces.
- Poor sewage systems let faeces contaminate drinking water.
- Another person drinks the water, and the bacteria reach their intestine.
Different controls break different links: sanitation keeps faeces out of water, water treatment makes the water safe, and food hygiene stops transfer during cooking.
The main routes
| Route | How the pathogen moves | Example and how to block it |
|---|---|---|
| Direct contact | Straight from one host to the next: touching skin, sexual contact, or an animal bite that passes the pathogen straight into the wound. | Touching an infected sore can spread some skin infections. Barriers must block the contact itself. |
| Indirect contact | Via a fomite. | Shared equipment can carry microbes. Cleaning and disinfection break this route. |
| Common vehicle | In food, water or a biological product. | Cholera in water can infect people who never meet. |
| Respiratory | In droplets or tiny particles breathed out, then breathed in or landing on the eyes, nose or mouth. | Distance, ventilation, particle size and time together matter, not just surfaces. |
| Vector | A living carrier moves the pathogen. | Dengue virus spreads mainly through infected female Aedes mosquitoes. Preventing bites or reducing mosquitoes blocks it. |
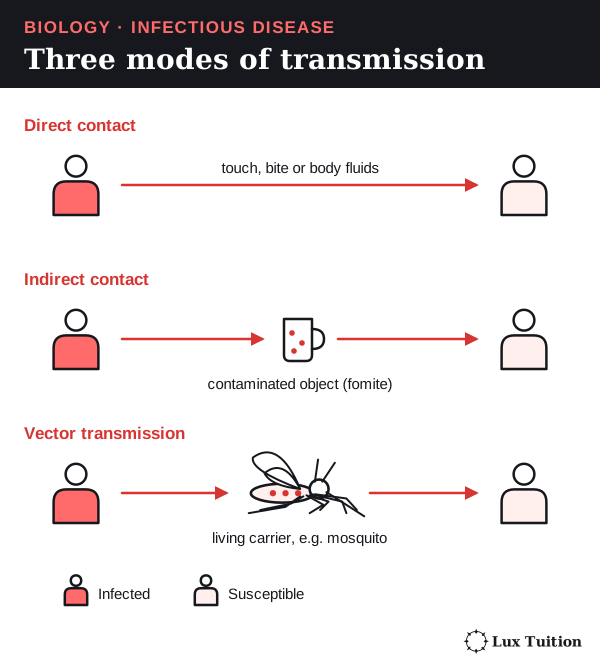
Some textbooks call short-range droplet spread “direct” and airborne spread “indirect”. In an exam, say what moves, through what, and into which tissue.
A biological vector is one the pathogen must develop or multiply inside, like the mosquito for dengue. A mechanical vector only carries the pathogen on its body.
In HSC questions, vector transmission counts as indirect. The pathogen passes from one host into another organism, the vector, rather than straight to the next host. For example, trypanosomes (single-celled parasites) carried by the tsetse fly cause sleeping sickness: indirect, vector transmission. OpenStax: modes of transmission.
How did Pasteur and Koch explain infectious disease?
Koch’s postulates
Pasteur’s experiments on microbial contamination
Before the late 1800s, many people believed in spontaneous generation: that microbes could appear from non-living matter, such as broth. Pasteur and Koch showed that microbes come from other microbes, and that particular microbes cause particular diseases.
Pasteur’s swan-neck flask experiment
Pasteur needed to separate two possible causes: air itself, or dust in the air that carries microbes.
- He boiled nutrient broth in flasks to kill the microbes already in it.
- Some flasks had a long S-shaped neck. Air could enter, but dust settled in the bend.
- Broth in the intact flasks stayed clear.
- When the neck was broken, or the broth touched the trapped dust, microbes grew.
The broth and heating were the same, so the only difference was whether dust could reach the broth. Microbes came from contamination, not from the broth. This challenged spontaneous generation. It did not show that every disease has the same cause. Institut Pasteur: the middle years.
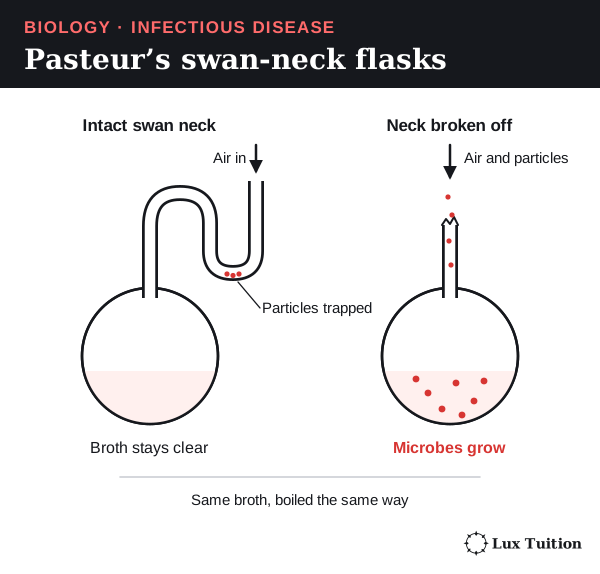
From flasks to pasteurised milk. Heating killed the microbes, and the curved neck kept new ones out. Pasteur’s work on heating wine led to the same idea for milk: pasteurisation. Heating milk kills most disease-causing microbes, so drinking it is less likely to cause infection.
Pasteurisation is not sterilisation (killing every microbe), so later contamination and storage still matter. Fewer outbreaks are linked to pasteurised milk, which fits this explanation. But outbreak counts alone ignore how many people drink each kind. Institut Pasteur: the development of pasteurisation.
Koch’s postulates
Koch set out a stricter test of whether one microbe causes one disease. His four postulates (rules):
- The microbe is found in every diseased organism, and not in healthy ones.
- It can be isolated and grown in a pure culture (containing only that microbe).
- Putting the cultured microbe into a healthy, susceptible host causes the same disease.
- The same microbe is isolated again from the newly diseased host.
The logic runs: association, isolation, reproducing the disease, confirmation.
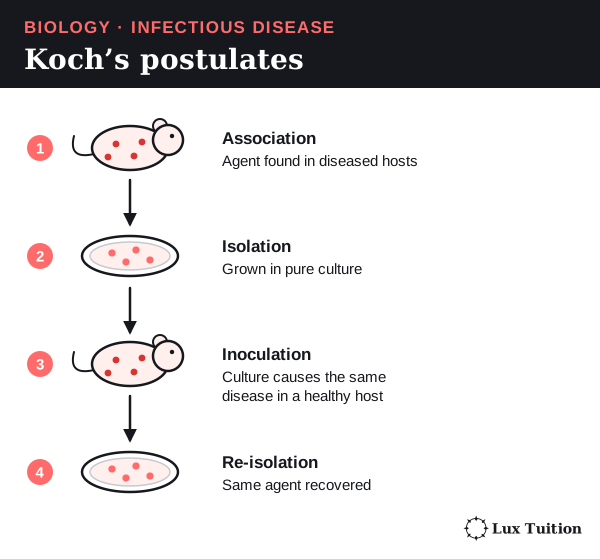
The postulates are a historical guide, not a perfect checklist:
- Carriers (infected people with no symptoms) break rule 1.
- Viruses need living cells, so they cannot grow in ordinary cultures.
- Some microbes cannot be cultured, and hosts differ in susceptibility.
- Deliberately infecting people to test rule 3 can be unethical.
Modern scientists combine molecular tests, tissue studies, population data and experiments. Finding a microbe’s DNA alone does not prove a living microbe caused the illness. OpenStax: Koch’s postulates and their limitations.
How do infectious diseases affect agricultural production?
plant diseases
animal diseases
Crop and livestock diseases cut food production and cost farmers money. An outbreak depends on three things together: the host, the pathogen and the environment.
Plant disease: wheat stripe rust
- Cause. Wind carries spores of the fungus Puccinia striiformis between crops.
- Infection. On a damp leaf, a spore germinates and grows in.
- Damage. Fungal threads feed on living leaf cells. Yellow-orange pustules (raised spots that burst to release spores) form in stripes and release more spores.
- Yield loss. Less healthy leaf means less photosynthesis (making food from light), so grains fill poorly and the harvest is smaller.
Outbreaks grow when susceptible varieties, nearby infected plants and suitable weather occur together.
Farmers plant resistant cultivars (varieties bred to resist the fungus), check crops regularly and spray fungicide (a chemical that kills fungi) at the right time. Resistance is not permanent: the fungus can change and overcome it. NSW DPI: stripe rust management, 2023.
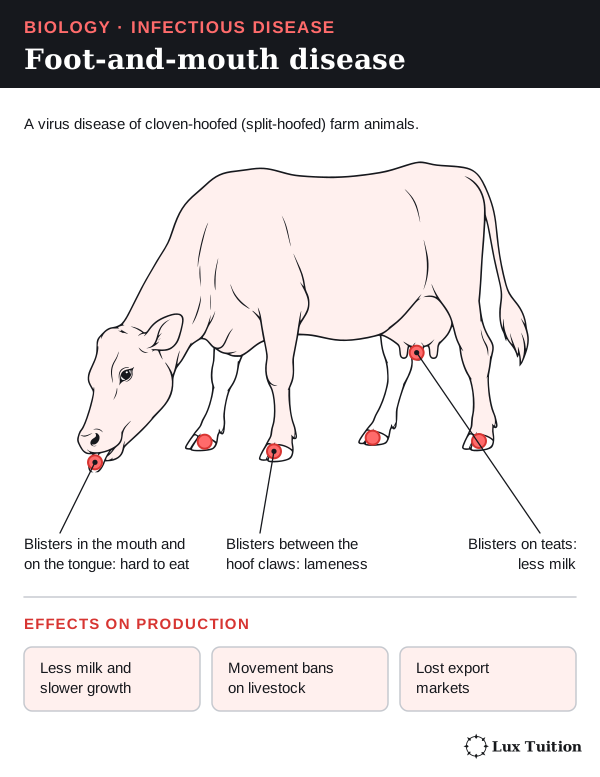
Animal disease: foot-and-mouth disease
Foot-and-mouth disease is caused by a virus that infects cloven-hoofed farm animals (animals with split hooves), such as cattle.
- Painful blisters form in the mouth, on the feet and on the teats.
- Animals eat less and go lame, so they produce less milk and meat.
- Livestock movements are banned and export markets close, so losses reach far beyond the infected animals.
Australia works to keep the disease out and has outbreak plans. Control combines fast detection, movement controls, biosecurity (measures that stop pathogens entering or spreading) and vaccination where suitable. A vaccine must match the virus strain and does not replace surveillance (ongoing monitoring for disease). CSIRO: foot-and-mouth disease.
Weighing up the effects
Count more than deaths: lower yield and quality, treatment and labour costs, disrupted breeding, trade restrictions, and destroyed plants, animals or products.
Crowded hosts give a pathogen more chances to spread. Spread also depends on how long a host stays infectious. All else equal, a host that quickly dies, recovers or is isolated has less time to pass the pathogen on, while infected animals that rarely die keep spreading it. High density plus infected hosts that survive is the combination that lets a disease sweep through a herd or crop.
A genetically uniform crop (plants with very similar genes) can share one weakness across a whole field; diversity helps but does not guarantee resistance. A strong answer links how the pathogen causes damage to the production loss, then weighs the cost, feasibility and limits of each control.
How are pathogens adapted to enter and spread between hosts?
An adaptation is an inherited feature that became common through natural selection: individuals with the feature survived and reproduced more, so it was passed on more often. Pathogens do not plan their features, and a feature only helps in the right host and environment.
To spread, a pathogen must overcome six challenges:
| Challenge | Feature that helps | What it means |
|---|---|---|
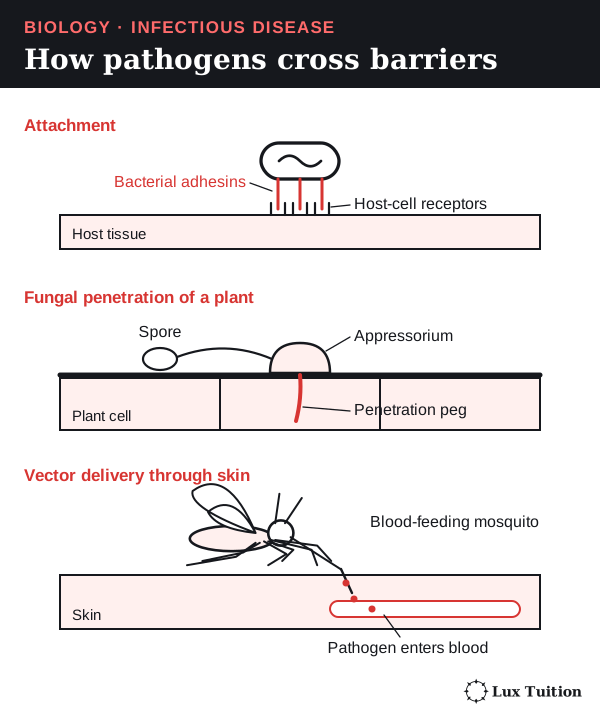
| Hold on before being washed away | Bacteria use sticky proteins called adhesins. Viruses use proteins that fit host receptors. | Both help sticking. Matching receptors explain which hosts and tissues are infected. |
| Get through a plant’s surface | Some fungi grow a swollen pad (an appressorium) and a narrow peg that pushes through, helped by enzymes. | A fungus can break in itself; a plant virus usually needs a wound or vector. |
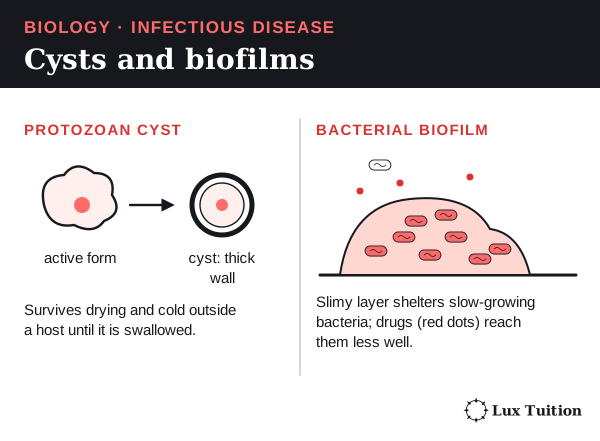
| Survive outside a host | Some protozoa form thick-walled cysts; some worms lay tough eggs. | These resting stages last longer, giving more time to be swallowed. |
| Get past animal skin | Pathogens in blood-feeding vectors are injected through the skin. | The vector gives a way in that microbes on unbroken skin lack. |
| Avoid the immune system | Antigenic variation: the pathogen changes its surface antigens. Others hide inside cells, away from antibodies (defence proteins that stick to specific antigens). | Immunity to one form may not protect against a changed one. Infected cells can still be found by T cells (white blood cells with different defensive roles: some kill infected cells, others help or regulate the response, covered later). |
| Leave the host | Coughing or diarrhoea spreads infectious material. | The same response that clears one host can expose another. Not every symptom is made directly by the pathogen; many come from the host’s own response. |
Some bacteria live in biofilms: crowded communities in a slimy layer. There they grow slowly and are sheltered, so drugs work less well. This tolerance is not inherited resistance, which comes from a mutation (a change in DNA) or a gained gene. OpenStax: virulence factors.
How does a plant or animal respond to infection?
How do plants defend against pathogens?
Start here: plants have no immune cells
Plants cannot move away from pathogens, and they have no white blood cells or antibodies, though they do have innate defences. Every plant cell must help defend itself, in two ways:
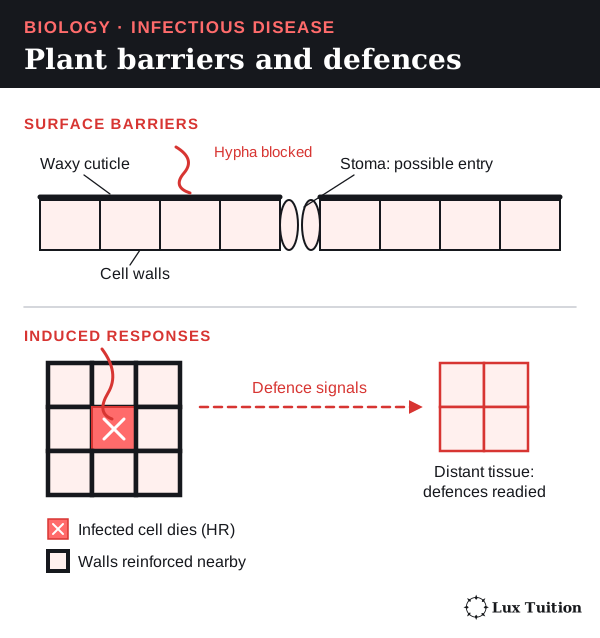
- Barriers that are always there, which block entry.
- Responses switched on after a pathogen is detected, which slow its spread.
Barriers that are always there
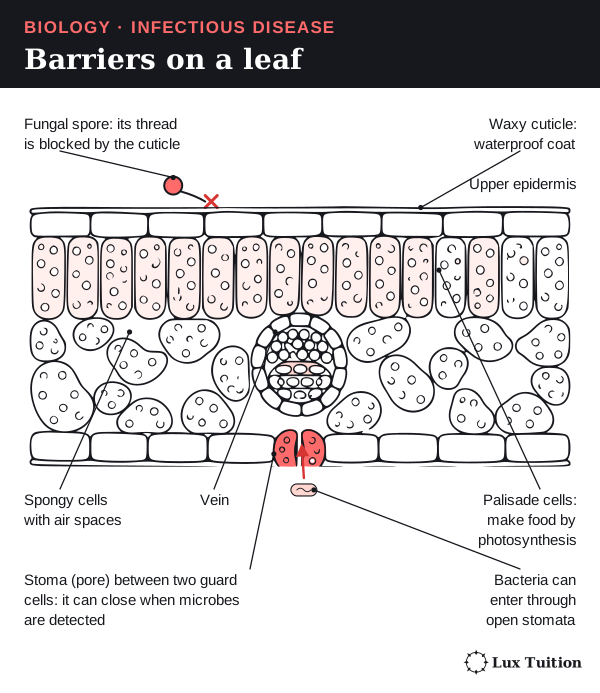
- The cuticle: a waxy, waterproof coat over the leaf.
- Cell walls around every plant cell, which are hard to break through.
- Bark on woody stems.
These reduce entry but are not impenetrable. Wounds, natural openings such as stomata (tiny leaf pores that let gases in and out) and special pathogen structures can get past them.
Responses after detection
Plant cells recognise molecules typical of microbes, or signs of their own damage. Chemical signals then switch on defences:
- closing stomata
- thickening cell walls with extra material
- making antimicrobial chemicals and enzymes. For example, chitinases break down chitin in fungal cell walls (not membranes).
- switching different genes on.
The hypersensitive response
In a hypersensitive response, cells around the infection deliberately die. The ring of dead tissue can restrict a pathogen that depends on living tissue. Sacrificing a few cells protects the plant, though this works poorly against organisms that feed on dead tissue.
Signals can also raise defences in parts not yet infected: systemic acquired resistance. This is not antibody-based memory like ours.
Gene-for-gene recognition (extension)
Resistance can depend on exactly which plant variety meets which pathogen strain. A plant resistance protein detects a matching pathogen effector (a molecule the pathogen releases to help infection), directly or through its effects, and triggers defence. If the pathogen changes so it is not detected, the plant may become susceptible. Strictly, the proteins made from the genes interact, not the genes themselves. OpenStax: plant defence responses.
How does river red gum respond to myrtle rust?
fungal pathogens
viral pathogens
Named example: river red gum and myrtle rust
- Plant: river red gum, Eucalyptus camaldulensis, a native Australian tree.
- Pathogen: the fungus Austropuccinia psidii, which causes myrtle rust.
Myrtle rust attacks young shoots, leaves, flowers and fruit of susceptible plants in the myrtle family, which includes eucalypts. Losing growing tissue reduces growth and reproduction, so infection can affect whole populations and ecosystems. Australian Government: myrtle rust.
The evidence. A 2019 controlled study in Brazil infected river red gums and other eucalypts with the fungus:
- The river red gums tested were resistant under the study conditions.
- They showed a hypersensitive response 336 hours (14 days) after inoculation: small patches of cells died.
- Susceptible eucalypts developed spore-producing pustules.
- Researchers combined leaf observations with microscope images, leaf-wax chemistry and measurements of fungal DNA.
Leaf surface properties seemed to help resistance, but the study did not establish one universally explanatory trait. Santos and colleagues, 2019.
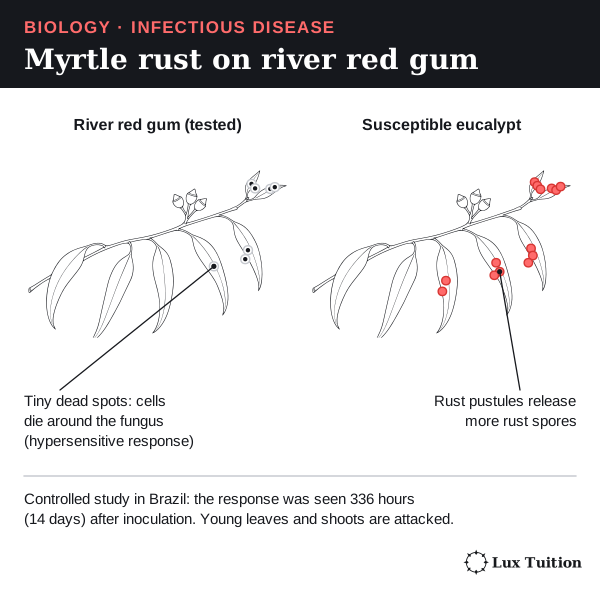
The study links a named host, a named fungus, a measured response and how well the pathogen did. Small areas of controlled cell death trap a fungus that needs living tissue; do not confuse them with large areas killed by uncontrolled disease. The result applies to the plants and conditions tested, not to every tree or rust strain.
Viral comparison: banana bunchy top
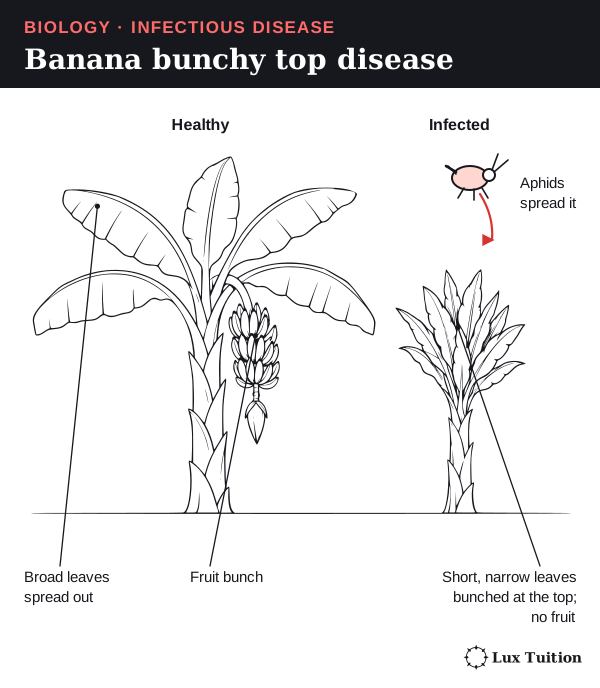
Banana bunchy top virus infects bananas grown in Australia. It is spread by particular aphids (small sap-sucking insects) and infected planting material. Infected plants show:
- dark green flecks and streaks on the leaves
- small, narrow, upright leaves bunched at the top
- stunted growth; early infection can stop fruit forming.
These are signs of disease, not of a successful defence. Symptoms alone cannot show which molecular defence, if any, was working. Queensland Government: banana bunchy top virus.
How do animal barriers respond to infection?
Start here: the three lines of defence
The immune system has two parts:
- Innate defences are present from birth. They act fast and respond to features shared by many microbes, or to damaged tissue.
- Adaptive defences take days to build. They use white blood cells called lymphocytes, each with receptors for one antigen. They are specific and can remember a pathogen.
A useful model has three lines of defence:
- First line: surface barriers that stop entry.
- Second line: innate responses inside the body, such as inflammation.
- Third line: adaptive responses by lymphocytes.
The lines overlap. Adaptive immunity can start while innate defences are still working.
First-line barriers
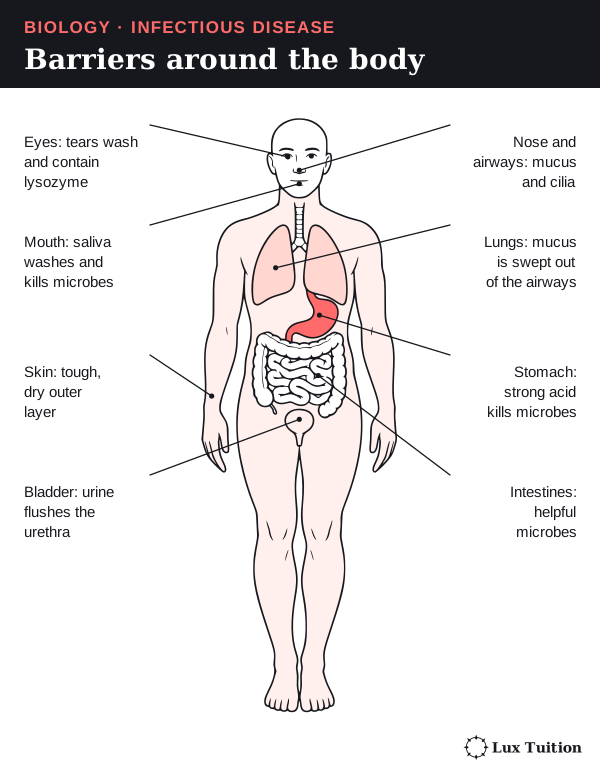
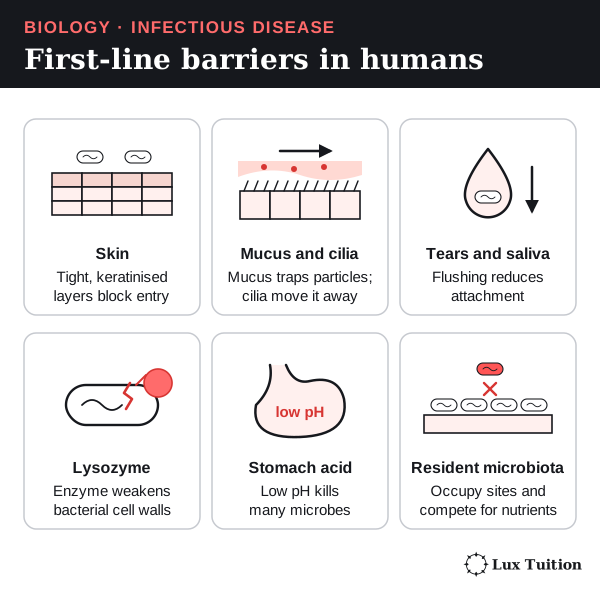
| Barrier | How it reduces infection | Limitation |
|---|---|---|
| Skin | Tightly joined epithelial (surface-lining) cells under a dry outer layer of dead keratin cells (keratin is a tough protein). The surface flakes off, taking microbes with it. | A cut gets past it. The skin surface is not sterile. |
| Mucus and cilia in the airways | Sticky mucus traps particles. Cilia (tiny hairs on lining cells) beat to sweep mucus to the throat. | Cilia move the mucus, not the microbes directly. Smoke can damage this system. |
| Tears, saliva and urine | Flowing liquid washes microbes away. | Flushing does not kill everything. |
| Lysozyme | An enzyme in tears and saliva that breaks down peptidoglycan, the main material of bacterial walls. | Viruses have no peptidoglycan, and bacteria differ in how easily they are damaged. |
| Stomach acid | Strong acid (very low pH) kills many swallowed microbes. | Some pathogens survive it. |
| Resident microbes | Harmless microbes take up space and nutrients and release substances that stop pathogens. | They can cause disease elsewhere in the body. |
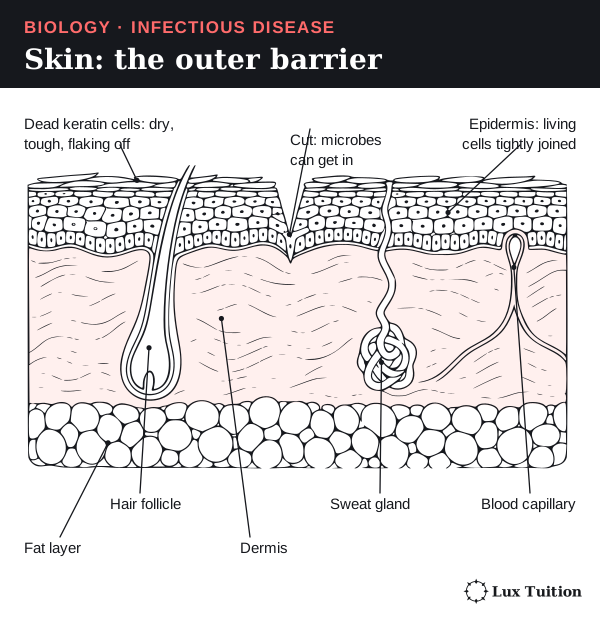
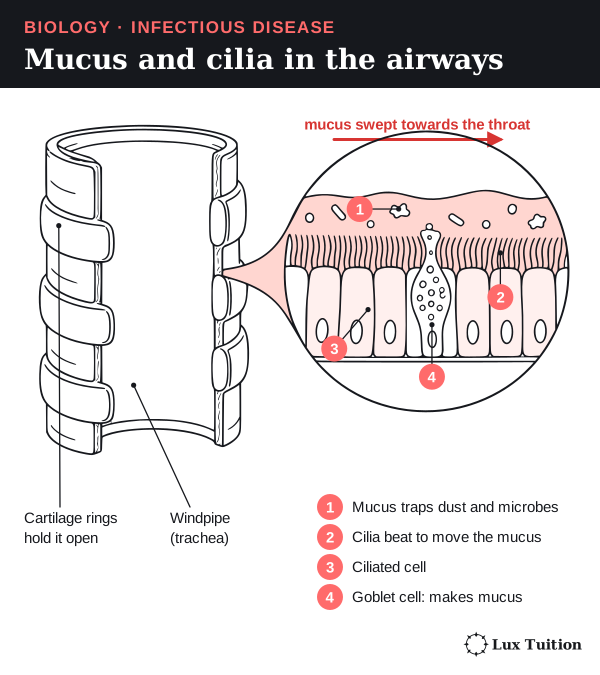
Barriers can be physical (blocking or washing), chemical (enzymes or acid) or biological (resident microbes). Tears are both physical and chemical. Some antibodies (adaptive molecules) also work at these surfaces, so the lines of defence overlap. OpenStax Microbiology: chemical defences.
How does inflammation change infected tissues?
Start here: the white blood cells
Each kind of white blood cell has its own job, and you need their names for the rest of this module. Some carry antigens to lymph nodes: small bean-shaped immune organs where white blood cells gather (explained in the antigen section).
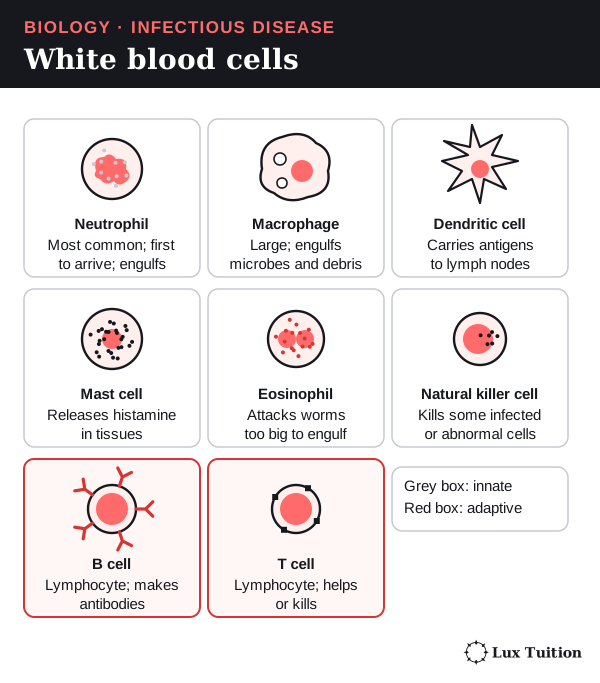
- Phagocytes engulf and digest particles. Neutrophils, macrophages and dendritic cells are phagocytes. Dendritic cells carry antigens to lymph nodes. Monocytes are blood cells that become macrophages once they enter tissue.
- Mast cells sit in tissues and release chemical signals such as histamine.
- Lymphocytes include B cells and T cells (adaptive) and natural killer cells (innate).
What inflammation is
Inflammation is the body’s fast, local response to injury or infection. It brings defence cells and proteins to the damaged area. Its four signs are redness, heat, swelling and pain.
Step by step
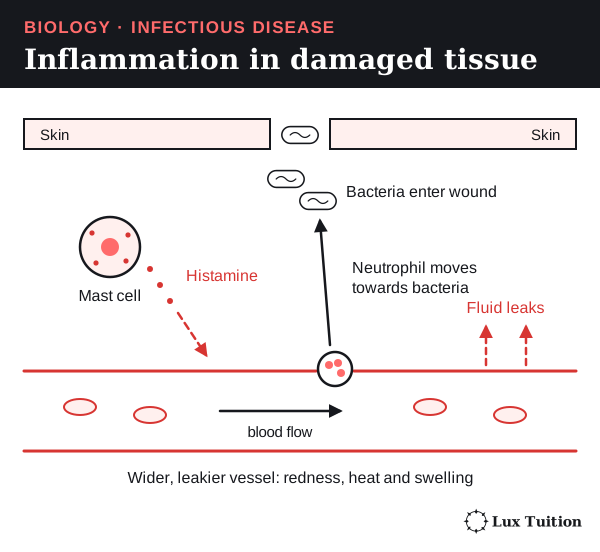
Imagine bacteria entering a cut:
- Detection. Immune cells in the tissue detect microbes; damaged cells release danger signals.
- Signals. Mast cells release histamine. Other cells release cytokines (signalling proteins) and chemokines (signals that attract cells).
- Vessels widen. Histamine causes vasodilation (widening of blood vessels), so more blood flows in: redness and heat.
- Vessels leak. Histamine also causes increased vascular permeability: the vessel walls become leakier, so fluid and proteins pass into the tissue, causing swelling.
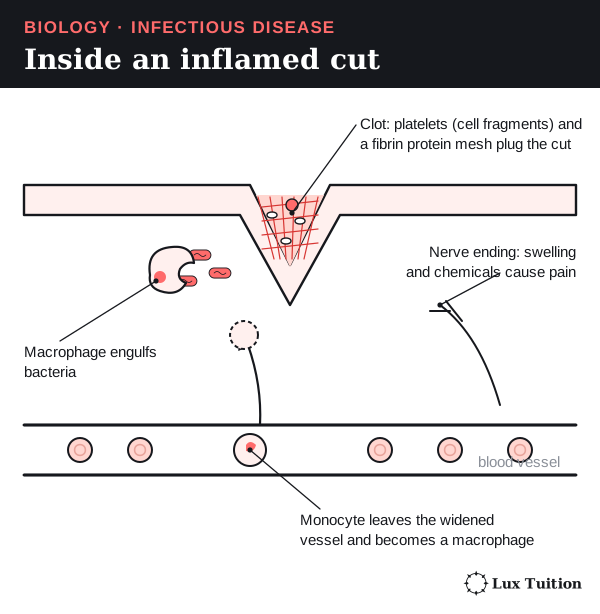
- Pain. Chemicals and swelling stimulate nerve endings (the tips of sensory nerves). Swelling and pain can make the area hard to use.
- White cells arrive. Inflammatory signals make neutrophils and monocytes stick to the vessel lining (adhesion). They then squeeze out between the vessel-wall cells and move towards the infection by following a gradient of chemical signals: chemotaxis.
- Clean-up and repair. Phagocytes engulf microbes and dead cells. Platelets (cell fragments in blood) and a protein mesh called fibrin form a clot that seals the wound; epithelial growth later restores the barrier.
Benefits and costs
Inflammation brings help, but too much or for too long damages healthy tissue. An injury with no microbes can cause the same signs, so inflammation does not prove infection. In answers, keep separate the signal (histamine), the responding tissue (vessel walls) and the result (swelling). OpenStax: inflammation and fever.
How does the human immune system respond to exposure to a pathogen?
How do phagocytosis and innate defences respond to pathogens?
Phagocytosis, step by step
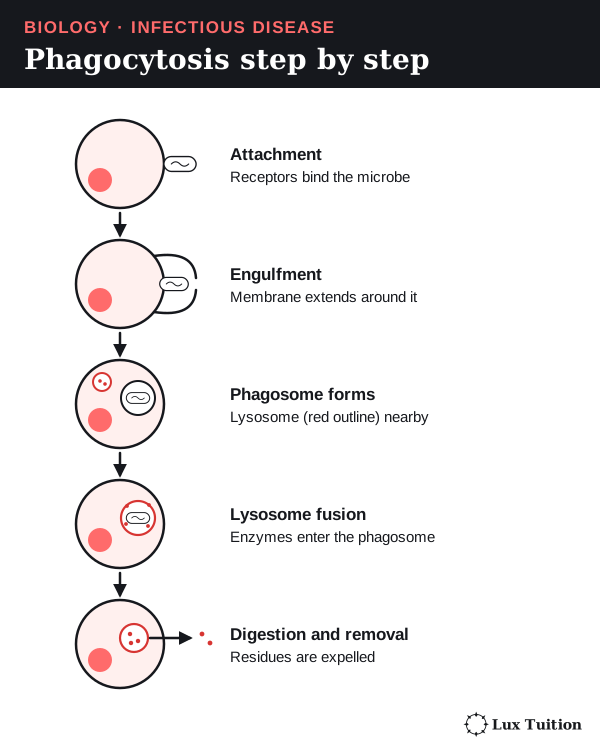
Phagocytosis (“cell eating”) is when a phagocyte surrounds a particle, takes it in and destroys it.
- Attach. Receptors on the phagocyte bind the microbe.
- Engulf. The phagocyte’s membrane flows around it.
- Enclose. The microbe sits inside a membrane bubble, a phagosome.
- Digest. Lysosomes (sacs of digestive enzymes) fuse with the phagosome and break the microbe down with enzymes and antimicrobial conditions.
- Remove. Useful materials are recycled and waste is pushed out.
Neutrophils arrive first and in large numbers. Macrophages also clear away dead cells. Dendritic cells are especially important for switching on T cells (next section).
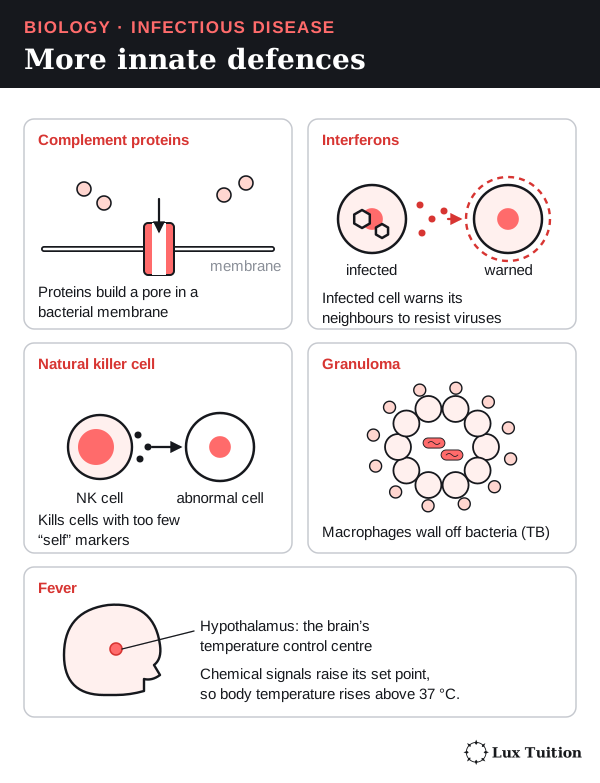
Complement is a set of blood proteins that act in a chain reaction. Antibodies or complement proteins coating a microbe make it easier for phagocytes to grab: this is opsonisation, the adaptive system (antibodies) helping the innate system. Some microbes survive inside phagocytes, so being engulfed does not always mean being killed. OpenStax: recognition and phagocytosis.
Other innate defences
| Defence | What it does | Watch out |
|---|---|---|
| Complement | Boosts inflammation, coats microbes, and can build a membrane attack complex: a pore that damages some microbes’ membranes. | Not an antibody; does not destroy every pathogen. |
| Type I interferons | Signalling proteins made by virus-infected cells and by some immune cells. Nearby cells switch on antiviral defences. | They signal host cells, not the virus. |
| Natural killer (NK) cells | Innate lymphocytes that weigh up ‘kill’ and ‘don’t kill’ signals. Cells with warning signs, such as too few MHC I markers (molecules that display a cell’s own proteins; see the next section), are killed by released cytotoxic (cell-killing) molecules. | Not phagocytes, and not antigen-specific T cells. |
| Fever | Signals reset the brain’s temperature centre, the hypothalamus, higher. A moderate rise slows some pathogens and can support defence. | Very high fever is harmful. Fever is a whole-body rise, not local warmth, and it does not sterilise the body. |
| Eosinophils and mast cells | Attack parasitic worms too big to engulf, releasing defensive molecules; mucus and muscle contractions help expel them. | The same responses cause allergies. |
A granuloma is a ball of immune cells, mainly macrophages, that forms around persistent material or infection the body cannot clear. In tuberculosis (TB, a bacterial lung disease) it can stop spread, but living bacteria may survive inside and tissue can be damaged. It is not just a wall of dead cells that guarantees the bacteria are destroyed. OpenStax Biology: innate immunity.
How does antigen presentation connect innate and adaptive immunity?
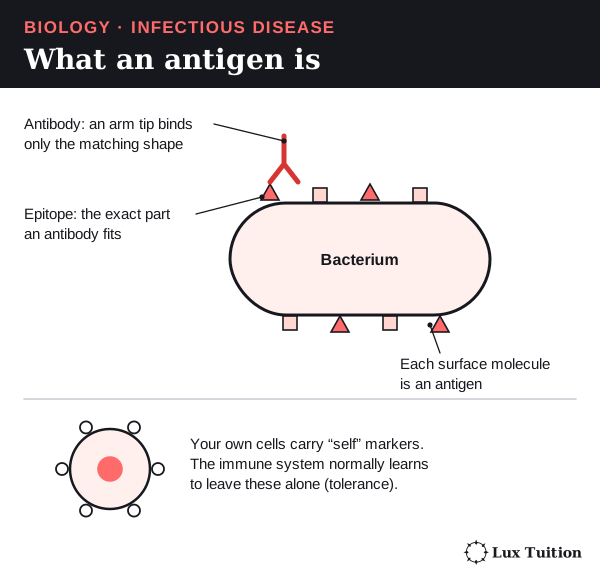
Start here: antigens and epitopes
The exact small part of an antigen that is recognised is the epitope.
- Antigens are found on pathogens, toxins, harmless things and our own cells.
- Most are proteins; some are carbohydrates (sugars).
- Recognition does not always cause harm. The body learns to leave its own molecules alone: tolerance.
How B cells and T cells see antigens
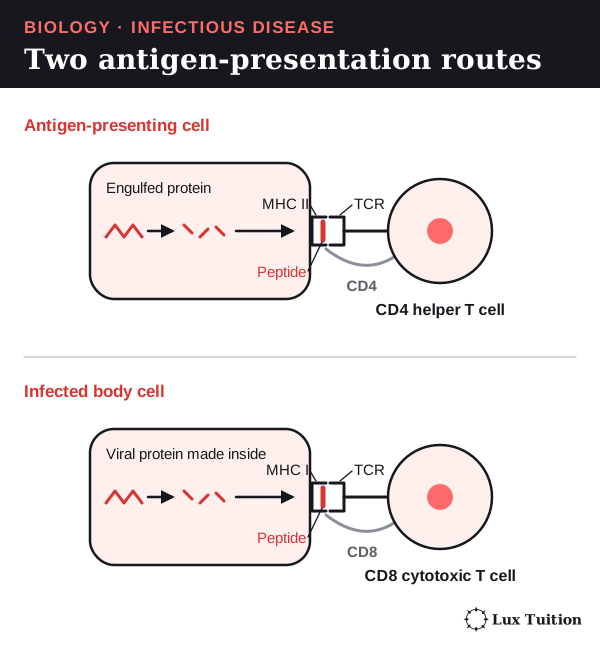
- B cells recognise whole antigens directly, using antibody-shaped receptors.
- Conventional T cells only recognise small peptides (short protein pieces) that another cell displays on holder molecules called MHC (major histocompatibility complex) molecules.
Displaying a peptide on MHC is antigen presentation. The T cell’s receptor recognises the peptide and MHC together.
| Pathway | Which cells show it | Which T cell responds | Result |
|---|---|---|---|
| MHC II | Antigen-presenting cells (dendritic cells, macrophages, B cells), showing pieces of engulfed microbes. | CD4 helper T cell | With extra signals, it becomes active and coordinates the response through contact and cytokines. |
| MHC I | Almost every body cell with a nucleus, showing pieces of proteins made inside it, including viral ones. | CD8 cytotoxic T cell | An activated cytotoxic T cell kills the infected cell. |
CD4 and CD8 are marker proteins that identify the two T-cell types.
The lymphatic system
The lymphatic system is a network of vessels and organs that carries lymph (tissue fluid drained into lymphatic vessels) back to the blood and houses lymphocytes.
- Bone marrow makes all blood cells. B cells mature there.
- The thymus, in the chest, is where T cells mature.
- Lymph nodes are where antigens, antigen-presenting cells and lymphocytes meet; their follicles are packed pockets of B cells. Dendritic cells carry antigens from infected tissue to the nearest node.
- The spleen filters the blood and responds to antigens carried in it.
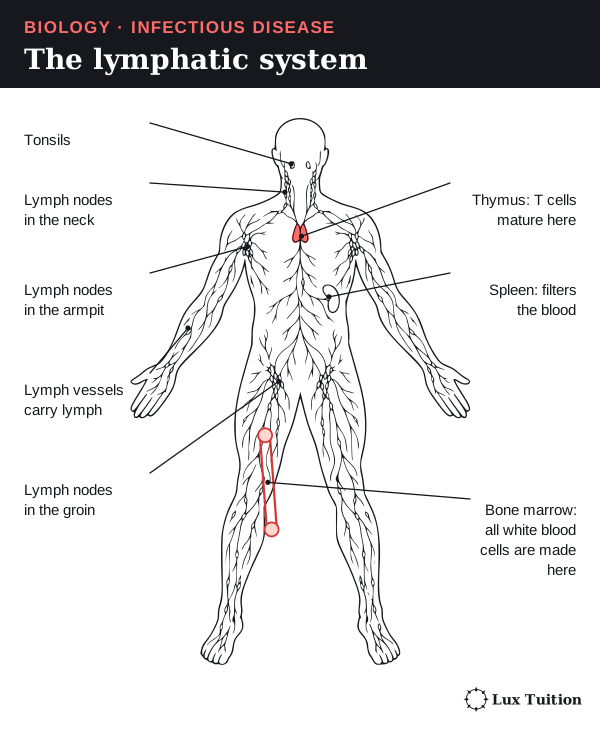
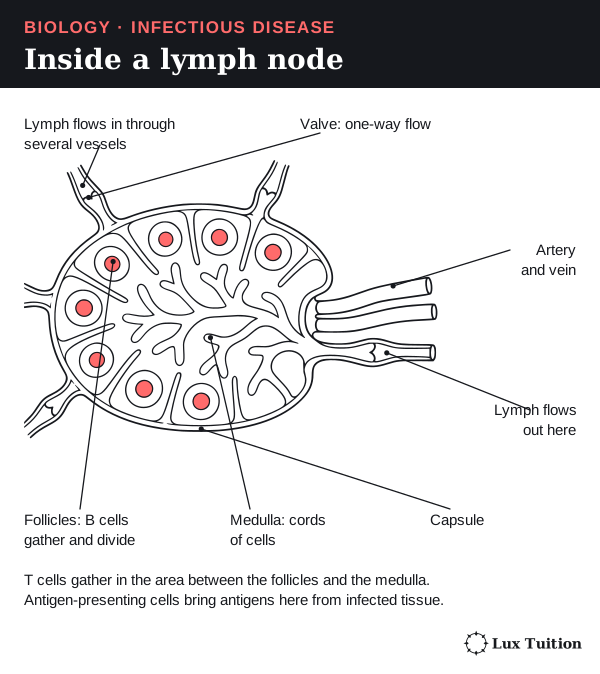
Lymphocytes multiplying during an infection make nodes swell (“swollen glands”). A swollen node or a white cell count alone cannot identify the pathogen. OpenStax: adaptive immunity.
How do B cells, clonal selection and antibodies provide immunity?
Clonal selection: the antigen picks the cell
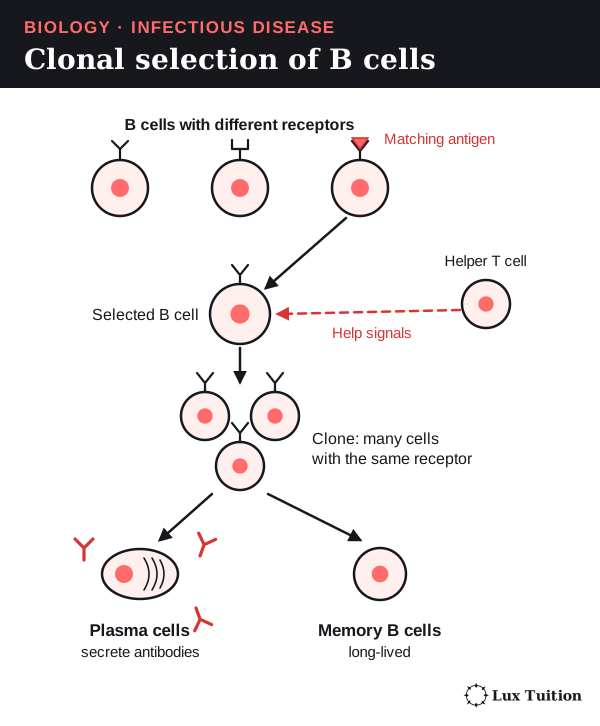
Before you meet a pathogen, you already have millions of lymphocytes, each with receptors for one antigen shape. An arriving antigen selects the rare lymphocyte that matches. It does not teach other cells to make new receptors.
The selected lymphocyte divides by mitosis (division into identical cells), making a clone of identical cells: clonal expansion. Some become effector cells that fight now; others become memory cells that respond faster next time.
This explains why the response is specific, and why a first response takes several days.
B cells and antibodies, step by step
The B-cell response is called humoral immunity because antibodies act in body fluids. For a typical protein antigen:
- A B cell’s receptor binds the matching antigen.
- The B cell takes the antigen in and shows pieces of it on MHC II.
- A helper T cell recognising those pieces gives signals by contact and cytokines.
- The B cell divides into a clone.
- Some become plasma cells, which release large amounts of antibody.
- Others become memory B cells, which later produce new plasma cells quickly.
Some plasma cells live for years and keep antibody levels up; they are not memory cells. A few antigens (such as some repeating sugar coats) can activate B cells with little T-cell help, but that response gives weaker memory. Janeway: B-cell activation.
What an antibody is
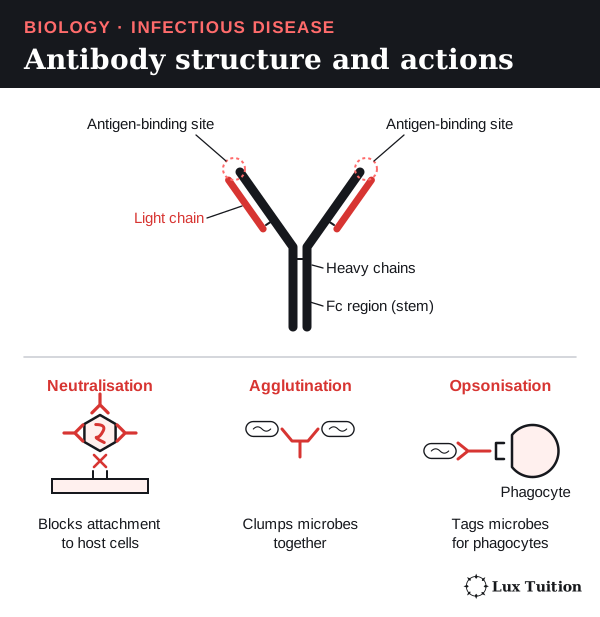
An antibody (also called an immunoglobulin) is a Y-shaped protein. It is a molecule, not a cell, so it cannot engulf anything.
- Its basic unit (monomer) has four chains: two long heavy chains and two short light chains. Secreted IgM joins five units together, and IgA often two.
- The arm tips are variable regions: two antigen-binding sites per unit, whose shape is complementary to (fits) one epitope. This fit explains specificity.
- The stem is the constant region, which other immune cells and proteins recognise.
| Action | How binding helps |
|---|---|
| Neutralisation | Covers a toxin or the part a pathogen uses to attach. |
| Agglutination | Links pathogens into clumps that are easier to clear. |
| Precipitation | Links dissolved antigens into less-soluble complexes that can be removed. |
| Opsonisation | Coats a target so phagocytes can grab it. |
| Complement activation | Some antibody classes, once bound, start the complement chain reaction (the classical pathway). |
There are five classes:
- IgM: important early in a first response.
- IgG: most common in blood; crosses the placenta (the organ joining mother and baby in pregnancy).
- IgA: protects mucous surfaces such as the gut, and is in breast milk.
- IgE: fights worms and causes allergies.
- IgD: mainly a receptor on B cells.
How does cell-mediated immunity destroy infected cells?
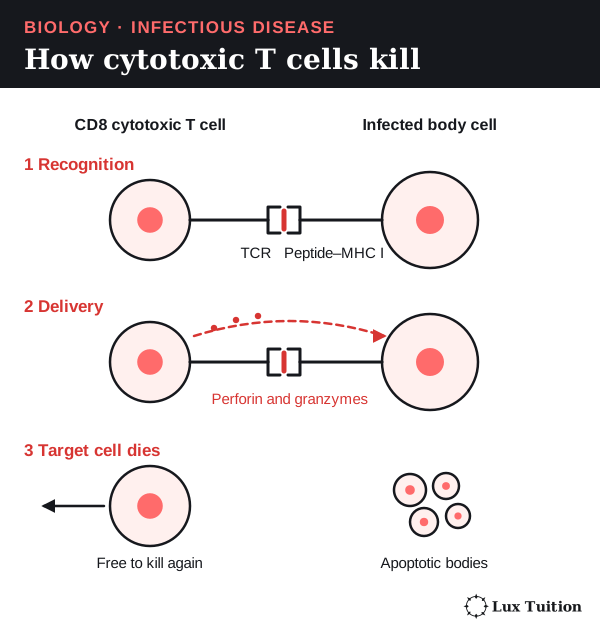
Antibodies work mainly outside cells, so they cannot reach a virus multiplying inside one. Cell-mediated immunity is the part of the adaptive response carried out by T cells, which deal with infected cells directly.
How a cytotoxic T cell kills an infected cell
- Recognise. An activated CD8 cytotoxic T cell finds a cell showing a matching viral peptide on MHC I.
- Attach. It binds tightly to that cell.
- Deliver. It releases perforin, which makes openings in the target’s membrane, and granzymes, enzymes that pass in through them.
- Trigger death. Granzymes switch on apoptosis: a tidy, programmed self-destruct that phagocytes clear up.
- Move on. The T cell lets go and attacks another infected cell.
Destroying the infected cell removes a site where new viruses were being made.
Helper T cells and memory
- A naive (not yet activated) CD8 T cell needs antigen presentation plus extra signals, often from CD4 helper T cells, to become active.
- A helper T cell never turns into a B cell or a cytotoxic T cell; they are separate cell types.
- Memory T cells give faster responses later.
- Regulatory T cells help calm the response once the infection clears, as activating signals are withdrawn.
- Helper T cells also make macrophages better at killing microbes that live inside them.
Which defence works best depends on where the pathogen is. Viruses outside cells are neutralised by antibodies; infected cells are killed by cytotoxic T cells. The two systems work together.
How do primary and secondary immune responses differ?
Acquired immunity is either active (your own response, with memory cells) or passive (transferred antibodies, covered under vaccination below).
The primary response
When a new pathogen gets in for the first time, events overlap but follow this order:
- Barriers act immediately.
- Innate defences start within hours: inflammation, complement, phagocytosis.
- Antigen presentation. Dendritic cells carry antigens to lymph nodes and activate matching lymphocytes.
- Clonal expansion. Selected B and T cells divide. This takes time, so antibody levels rise only after a lag of several days.
- Clearing. Antibodies and effector T cells reduce the pathogen.
- Memory. Most effector cells die off, but memory B and T cells, and some long-lived plasma cells, remain.
The secondary response
If the same antigen returns, memory cells make the antibody response:
- faster (shorter lag)
- stronger (much higher levels)
- longer-lasting
- often better fitting: higher average antibody affinity (tighter binding to the antigen).
This can prevent disease or make it milder, but not always for life. Immunity can fade, and pathogens whose antigens change can infect again.
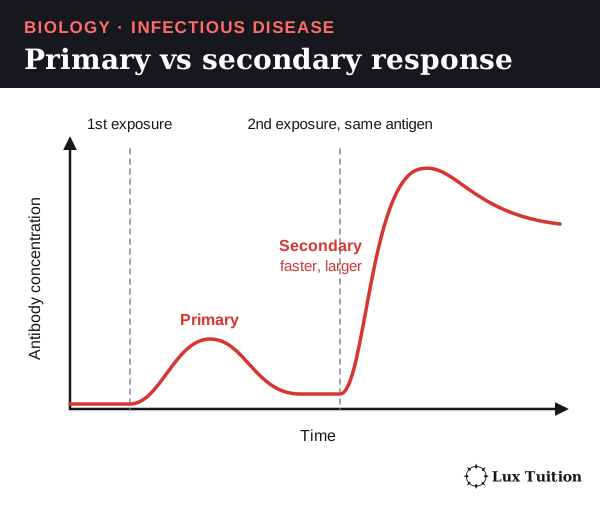
Exam graph tips. Label both axes. Mark the first and second exposures to the same antigen. The secondary curve must start rising after the second exposure, but sooner and more steeply than the primary. A different antigen gives another primary response. The curve shows a principle, not exact timings. For choosing a graph type, see Working Scientifically skills.
Modelling the whole response
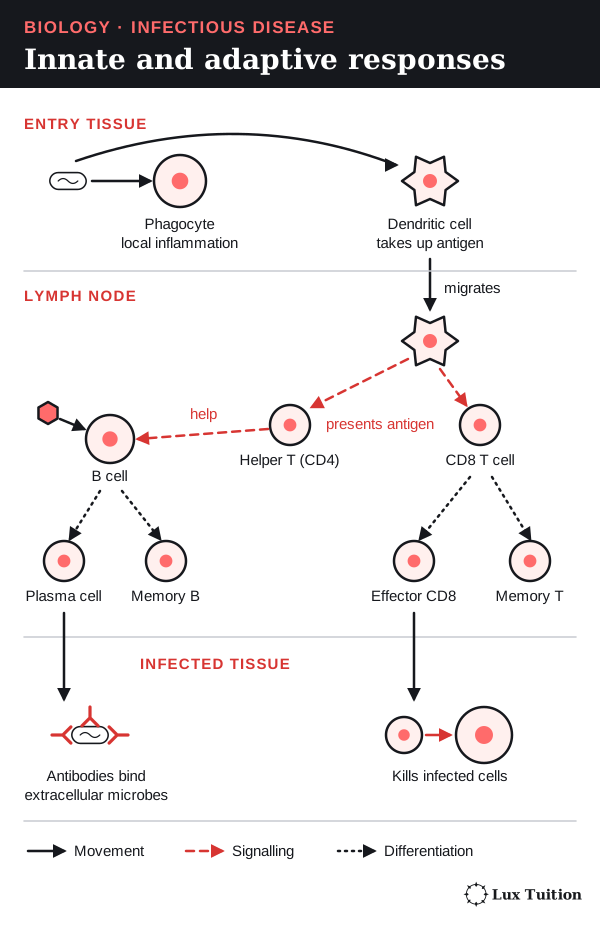
A good model shows three places: the entry tissue, the draining lymph node (the nearest node lymph flows to) and the infected tissue. It shows dendritic cells moving to the node, helper T cells signalling, B cells and CD8 T cells multiplying separately, antibodies travelling in body fluids and effector T cells returning to the tissue.
Use different arrows for cells moving, chemical signals and cells changing type. A single straight-line chain hides the overlap between innate and adaptive defences. Check for errors: for example, an arrow showing a B cell becoming a cytotoxic T cell is wrong. See trends, causes and models.
How can the spread of infectious diseases be controlled?
How can dengue transmission be controlled locally and globally?
Named disease: dengue
- Pathogen: dengue viruses.
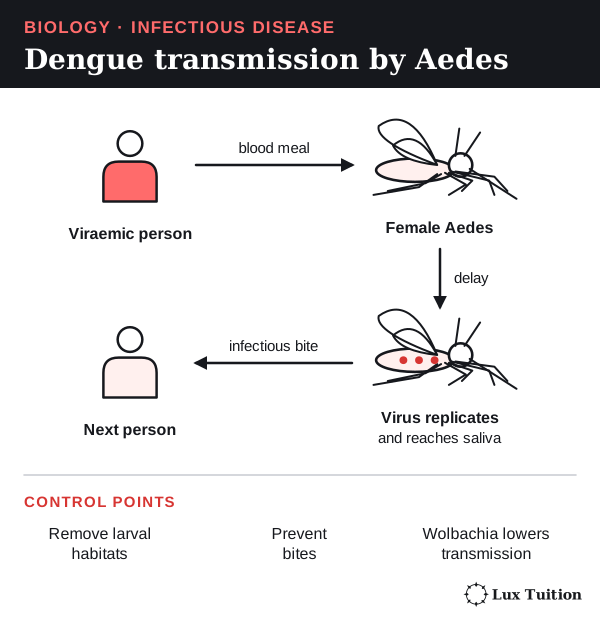
- Vector: mainly infected female Aedes aegypti mosquitoes; other Aedes species can also spread it.
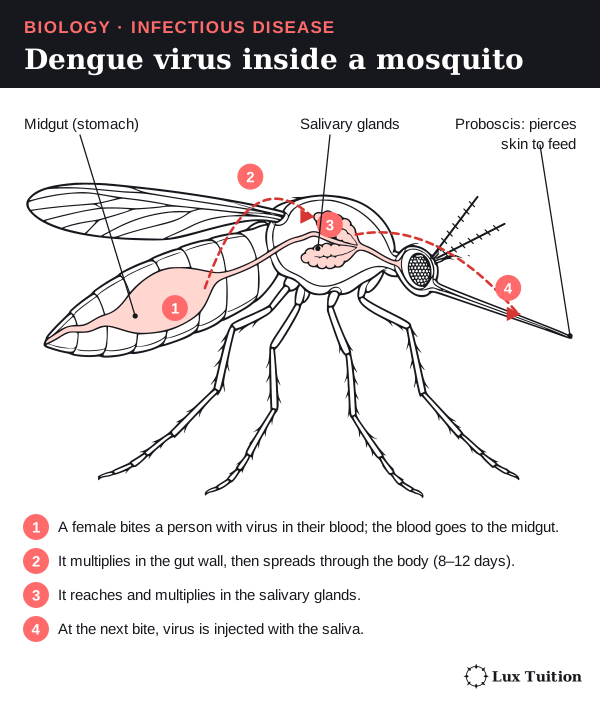
How the virus travels through the mosquito
- A female bites a person with virus in their blood.
- The virus multiplies in the mosquito’s gut and spreads through its body over several days.
- It reaches the salivary glands (which make saliva).
- At the next bite, virus is injected with the saliva.
People can pass virus to mosquitoes before they feel sick, including people without symptoms. WHO: dengue and severe dengue.
Limiting spread at three scales
| Scale | What helps spread | Matching controls |
|---|---|---|
| Local (homes and streets) | Water containers and rubbish give mosquitoes places to breed. Crowding and frequent bites create repeated contact. Unreliable water supply forces people to store water. | Covering water, removing containers, reliable water and rubbish services, window screens. Campaigns work better when people have practical alternatives. |
| Regional (a city and districts) | Rain and temperature affect mosquito numbers; temperature also affects viral development inside mosquitoes. Commuting links areas. Uneven immunity and control leave gaps. | Shared surveillance (tracking cases and mosquitoes), coordinated control, easy diagnosis. An untreated area next door keeps transmission going. |
| Global | Travel carries infected people; trade carries mosquitoes. Countries have unequal resources. | Sharing information, checks at entry points, research and support. An introduced case only spreads where suitable mosquitoes and conditions exist. |
Immunity to dengue is complicated
There are four main types (serotypes) of dengue virus. Infection usually protects well against the same type but only briefly against the others, and a later infection with a different type can be more severe. So people who have had dengue are not immune to all future dengue. Dengue vaccines do exist, but who can have them depends on the product and setting.
How do prevention measures interrupt disease transmission?
hygiene practices
quarantine
vaccination, including passive and active immunity (ACSBL100, ACSBL123)
public health campaigns
use of pesticides
genetic engineering
Prevention works best when it targets how a disease actually spreads. Cleaning drinking water will not stop an infection spread through the air.
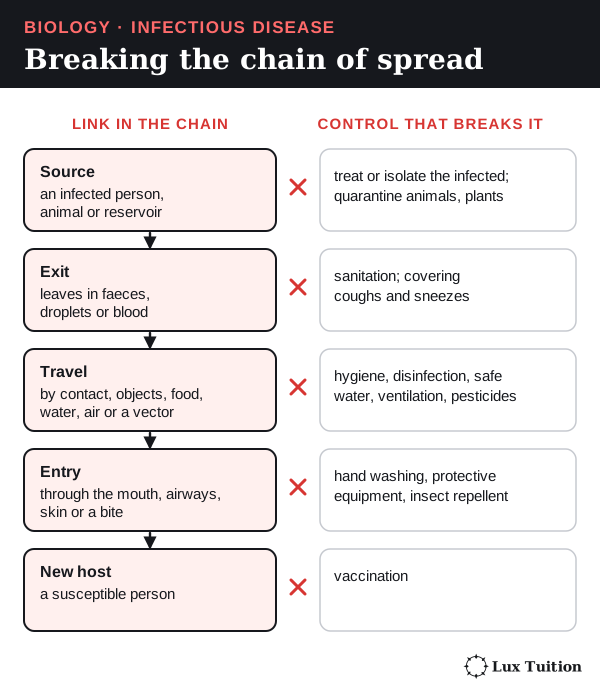
| Procedure | Which link it breaks | Strengths and limits |
|---|---|---|
| Hygiene and sanitation | Hand washing, safe food, sewage treatment and safe water reduce transfer. Ventilation clears infectious particles from air. | Needs infrastructure and correct use. Cleaning, disinfection (killing most microbes) and sterilisation (killing all) differ. |
| Isolation and quarantine | Isolation separates infected people. Quarantine restricts exposed people who may become infectious. Biosecurity controls animals, plants and materials. | Works best early. How long quarantine lasts depends on the disease, the exposure, the incubation period (the time from infection to symptoms), the infectious period and the testing strategy, because an exposed person can become infectious before symptoms start. One symptom check is not enough: people can spread some infections before symptoms appear, or with none at all. Support and fair rules affect how well people follow it. |
| Vaccination | Giving a vaccine (a safe form of an antigen) lowers the chance of infection, severe disease and, for some vaccines, spread. | Needs access, cold storage, uptake and time. Protection can fade or differ between strains. |
| Public health campaigns | Explain actions, symptoms and reporting in languages people use. | Information is not enough without water, transport, sick leave or care. Judge by changed behaviour and fewer cases. |
| Pesticides | Chemicals that kill pests: larvicides kill mosquito larvae, adulticides kill adults, fungicides kill fungi. | Resistance, exposure risks, harm to other species and repeated spraying limit them. Removing breeding sites helps. |
| Genetic engineering | Changing DNA to make hosts resist disease, make vaccine antigens, or change vectors. | Effects vary; species- and construct-specific effects need ecological monitoring and sustained delivery, plus regulation and community agreement. A toxin that kills one target pest leaves other pests unharmed. With less competition they can multiply (secondary pests), so total pesticide use may rise again. The target pest can also evolve resistance. See Bt cotton in Module 6. |
Genetic technology example: the hepatitis B vaccine
This has appeared in HSC exams. Hepatitis B is a liver disease caused by the hepatitis B virus (HBV). A recombinant vaccine (made using DNA from two sources), such as Recombivax HB, is made like this:
- Take the gene for one viral protein, the hepatitis B surface antigen (HBsAg).
- Insert it into a DNA construct (a carrier that lets the gene be read in another organism).
- Put the construct into yeast cells.
- The yeast make HBsAg.
- Collect and purify the HBsAg, then formulate the vaccine.
Only this one antigen is made, never a whole infectious virus. CDC: hepatitis B vaccine production; Recombivax HB product information, sections 11–12.
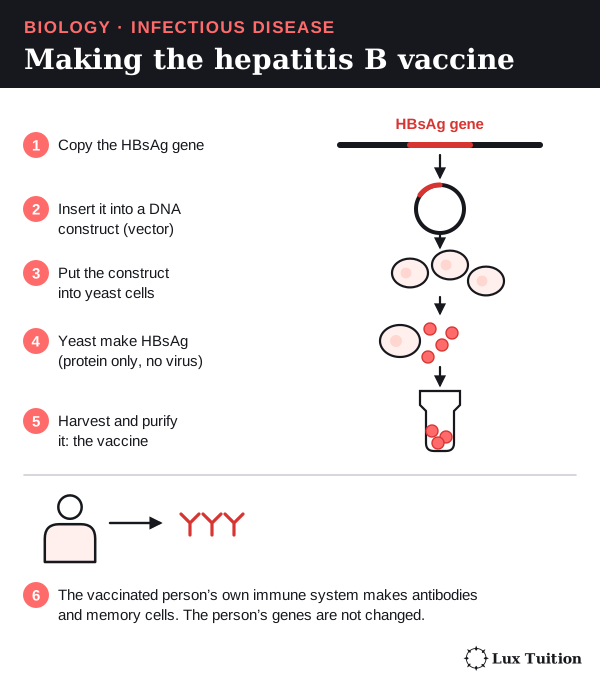
The vaccinated person’s immune system then makes antibodies and memory cells against HBsAg, preventing infection and later liver disease. Keep these straight:
- The engineering happens in the yeast; the person’s genes are not changed.
- Protection is not universal: it depends on access, correct use and each person’s response.
- The vaccine prevents infection; it does not cure someone already chronically infected, so it works alongside screening, infection control and treatment.
Changing the vector: two approaches
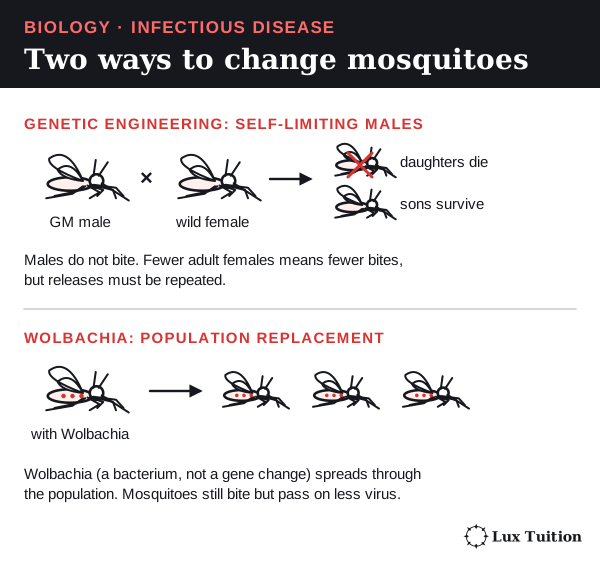
Genetically modified Aedes. Scientists release “self-limiting” GM males:
- GM males mate with wild females.
- They pass on a change that stops female offspring reaching adulthood.
- Fewer adult females means fewer bites and less virus spread.
Males do not bite, and releases must be repeated. Fewer mosquitoes is not the same as measured fewer human cases. CDC: genetically modified mosquitoes.
Wolbachia is a bacterium. Mosquitoes carrying it pass on less dengue virus, and it spreads through the population. This lowers vector competence (how well a mosquito can transmit the virus). It is not genetic engineering, and it replaces mosquitoes rather than reducing their numbers.
How do active and passive immunity differ?
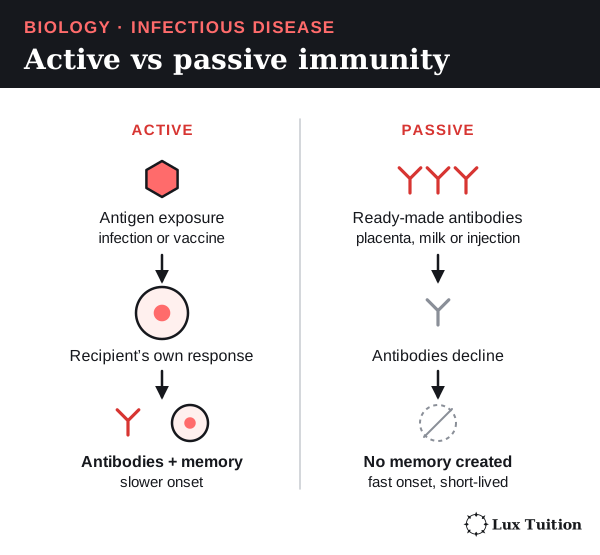
Active immunity: your own response
Active immunity is protection made by your own immune response, producing memory cells.
- Natural: from being infected.
- Artificial: from vaccination, which shows the immune system antigens, or instructions to make them, in a safe form.
It gives memory without the person having to suffer the full disease. It takes time to develop. Booster doses can strengthen it; how long it lasts varies.
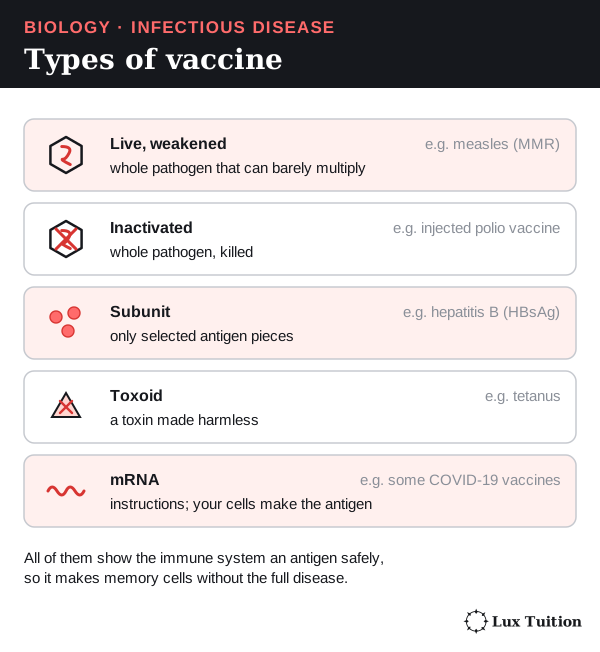
A toxoid is a toxin made harmless; it protects against the toxin, not every part of the bacterium. Vaccines can reduce infection, severe disease or spread, each to a different degree, and not all give lifelong protection.
Passive immunity: borrowed antibodies
Passive immunity comes from ready-made antibodies from someone else.
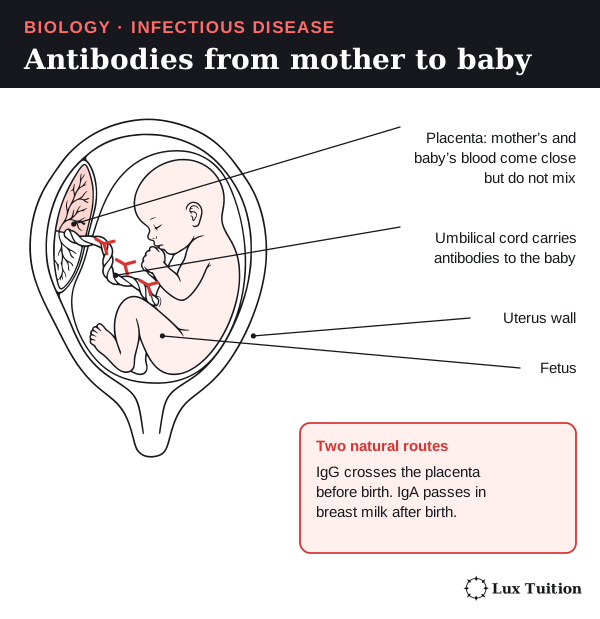
- Natural: a mother’s IgG crosses the placenta into the baby; IgA in breast milk protects the baby’s gut.
- Artificial: an injection of antibodies, such as a monoclonal antibody (many copies of one antibody).
For example, antibodies injected straight after a rabies-risk bite give artificial acquired passive immunity. It works straight away but fades as the antibodies break down. Your lymphocytes were not activated, so there is no memory. This counts as immunisation, but not vaccination. CDC: principles of vaccination.
Herd protection
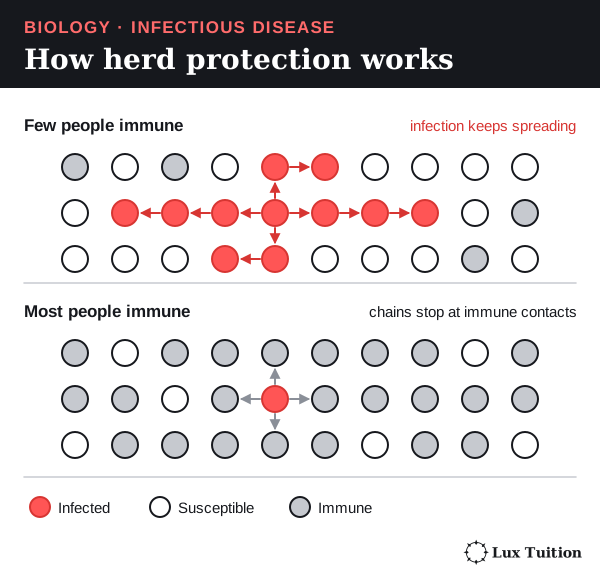
If enough people are immune and immunity stops spread, the pathogen struggles to find susceptible hosts, so unvaccinated people are indirectly protected: herd protection. It depends on the pathogen, how people mix and how strong and evenly spread the immunity is.
The percentage vaccinated is not the same as the percentage immune: some vaccinated people are not fully protected, and protection can fade. So you cannot plug vaccination coverage straight into the susceptible fraction. Tetanus is the exception: it comes from soil spores, so others’ vaccination does not protect you.
How effective are antibiotics and antivirals against infectious disease?
antivirals
antibiotics
Antibiotics
Antibiotics work only on bacteria that are susceptible to them.
Penicillin, step by step:
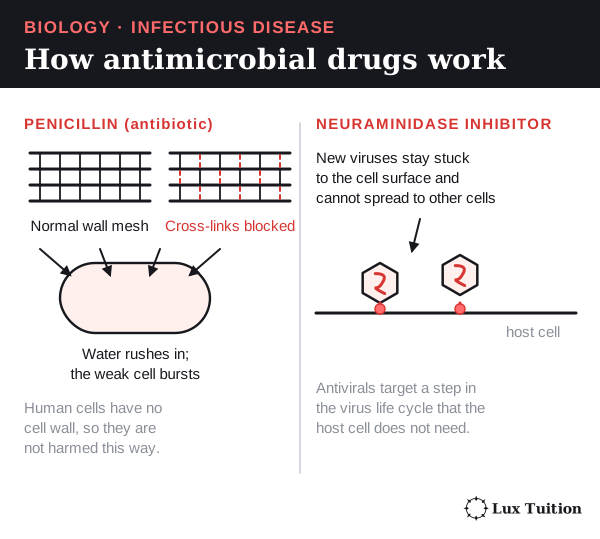
- A bacterial wall is made of peptidoglycan, a mesh of chains joined by cross-links.
- Penicillin blocks the enzymes that build those cross-links in a growing bacterium.
- The wall weakens.
- Water enters by osmosis and the cell can burst.
Other antibiotics block bacterial ribosomes, which stops the bacteria making polypeptides (proteins); others block DNA copying or chemical pathways. Human cells have no peptidoglycan, so penicillin harms bacteria but not our cells: selective toxicity. Side effects and harm to helpful bacteria can still occur. Viruses have no wall or ribosomes, so antibiotics do not treat viral infections.
- Bactericidal drugs kill bacteria.
- Bacteriostatic drugs stop them multiplying so the immune system can clear them.
Neither label alone decides which drug is best under relevant conditions.
How well a drug works depends on correct diagnosis, susceptibility, how much drug reaches the site, timing, side effects and the patient.
Antivirals
An antiviral blocks one step in a virus’s life cycle. Influenza neuraminidase inhibitors block an enzyme on the virus, so new viruses stay stuck to the cell and spread less. Others block genome copying, entry, integration or protein processing.
Viruses use the host’s machinery, so safe targets are hard to find. An antiviral for one virus may not work on another. Starting early helps many short infections; some infections can be cured, others only controlled by long-term suppression. CDC: influenza antiviral summary.
Resistance evolves
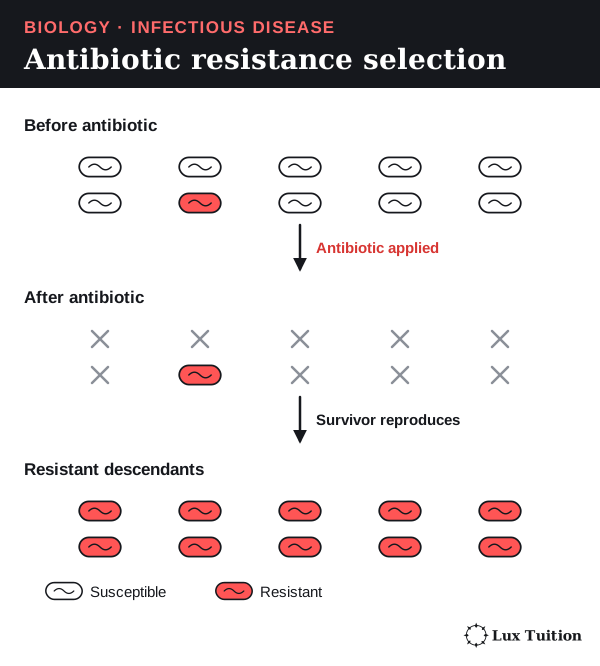
Antibiotic resistance spreads by natural selection:
- Bacteria vary. Some already have, or gain by mutation, a gene that helps them survive the drug. Bacteria can also pass genes to each other (horizontal gene transfer).
- The antibiotic kills susceptible bacteria.
- Resistant ones survive and multiply.
- Over generations, resistant bacteria take over, and resistant strains spread between hosts.
Bacteria resist by changing the drug’s target, breaking the drug down, letting less in or pumping it out. The bacteria become resistant, not the person. CDC: antimicrobial resistance.
Judging a treatment
First decide what “works” means: shorter illness, less pathogen, fewer hospital stays, fewer deaths or less spread.
- A lab result does not show how much a drug helps people.
- One person recovering is weak evidence, because some recover anyway.
- A controlled clinical trial comparing similar groups, with confidence intervals (a range showing how precise the estimate is, such as 95% confidence), is much stronger.
Cost, access, side effects and resistance affect real results. Feeling better does not always mean the infection or its spread has stopped.
How do environmental management and quarantine control epidemics?
Key words
- A pandemic is an epidemic that spreads across countries or continents. The word describes how far it spreads, not how deadly it is.
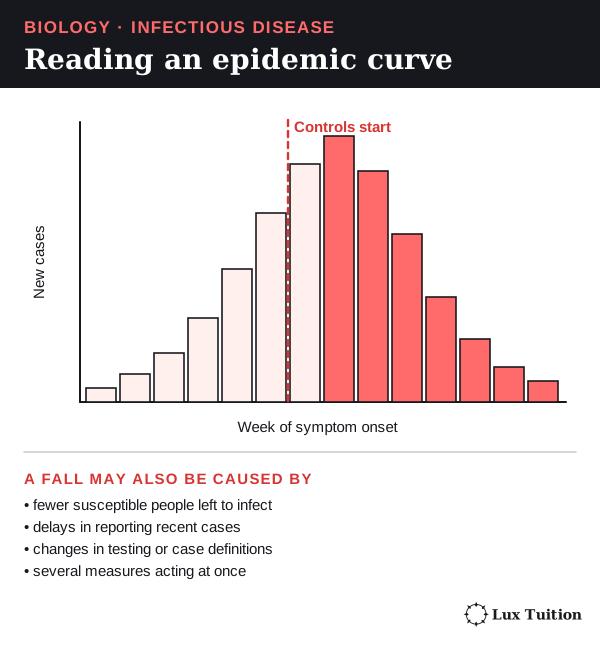
- An epidemic curve graphs new cases against the time people got sick (onset) or were reported.
A fall in cases after a control measure is worth investigating but is not proof it worked. Reporting delays, testing changes, several measures at once and running out of susceptible people can also bend the curve.
Case study: West African Ebola epidemic, 2014–2016
Ebola is a severe disease spread by direct contact with an infected person’s body fluids and contaminated materials. Controls targeted those routes:
- Environmental management: protective equipment, disinfecting equipment and surfaces, safe disposal of infectious waste.
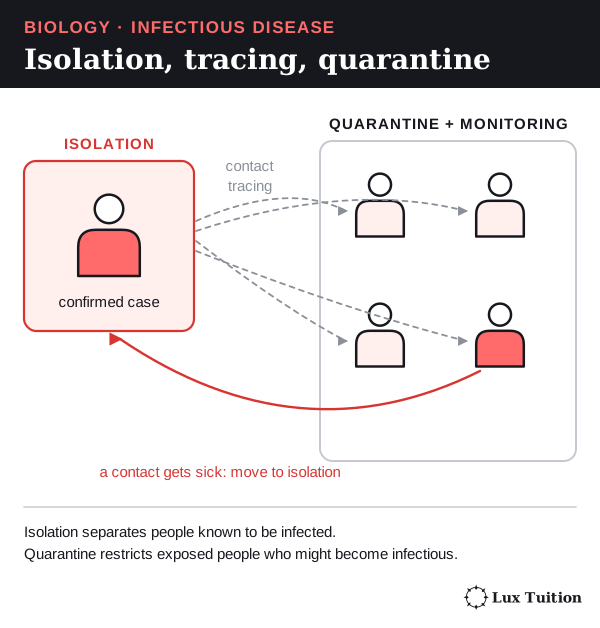
- Isolation: separating infected patients while caring for them.
- Contact tracing: finding exposed people so they could be monitored and isolated if they fell sick.
- Quarantine: restricting exposed people not yet known to be infected.
Each measure has a limit:
- Cleaning cannot stop unnoticed contact.
- Isolation needs early recognition, care and staff.
- Tracing depends on accurate information and trust.
- Restrictions without food, support or clear communication stop people reporting illness.
So evaluate both the effect on spread and whether people could use the measures. WHO: technical support during the Ebola epidemic.
Safe and dignified burials. Bodies of people who died of Ebola are highly infectious. WHO’s 2014 protocol used trained teams to combine infection control with family involvement and respect for religious practices. Working with communities this way helps people accept measures. Because many measures acted together, a fall in cases cannot show how much each one helped. WHO, 7 November 2014.
How are incidence and prevalence used to interpret infectious disease data?
mobility of individuals and the portion that are immune or immunised (ACSBL124, ACSBL125)
Malaria or Dengue Fever in South East Asia
Incidence and prevalence
The difference is new cases versus existing cases.
- Incidence: new cases during a set time.
- Cumulative incidence = new cases ÷ people at risk at the start.
- Incidence rate = new cases ÷ total person-time at risk (for example, person-years).
- Prevalence: everyone who has the condition.
- Point prevalence = people who have it at one moment ÷ total population.
- Period prevalence counts anyone who had it during a set interval.
Incidence can be given as a simple count of new cases in a stated period, and prevalence as a count of existing cases. To compare populations of different sizes, divide by the right denominator (bottom number) to get a proportion or rate. People who have already recovered are not counted in a later point prevalence. CDC: measures of disease frequency.
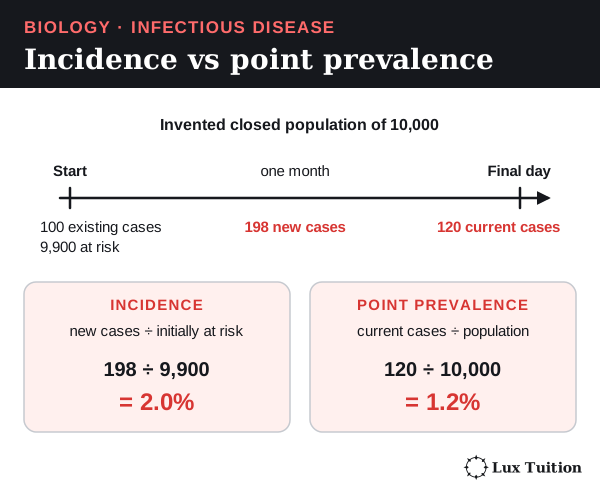
Worked example (invented data). A closed population of 10,000 starts a month with 100 infected, so 9,900 are at risk. During the month 198 of them become infected. On the last day, 120 are still infected.
- Cumulative incidence = 198 ÷ 9,900 × 100 = 2.0%
- Point prevalence = 120 ÷ 10,000 × 100 = 1.2%
Prevalence can fall as people recover, even while new infections continue.
Fair comparisons need the same case definition, period and denominator. More testing finds more cases even if spread has not changed. Delays, symptom-free cases, repeat infections, movement and missing records distort trends. Fewer deaths can reflect better treatment, not fewer infections.
South-East Asian example: Wolbachia and dengue in Yogyakarta
A cluster-randomised trial randomly assigns whole areas, not individuals.
- Design: 12 areas received Wolbachia mosquito releases; 12 had normal mosquito control only (which continued in release areas too).
- Results: among eligible clinic patients with fever, confirmed dengue was found in 67 of 2,905 from release areas and 318 of 3,401 from comparison areas. That is about 2.3% and 9.4% of clinic participants, not population prevalence or yearly incidence.
- Estimate: 77.1% protective efficacy, 95% confidence interval 65.3–84.9%. The analysis compared dengue-positive and dengue-negative clinic patients (a test-negative design), so the clinic percentages are not population risks.
Utarini and colleagues, 2021, trial abstract.
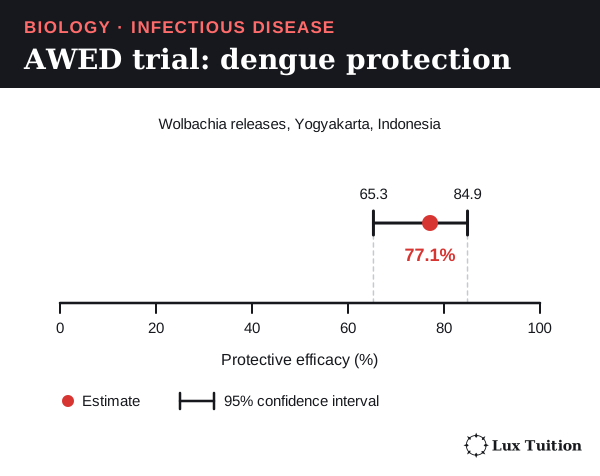
This shows a large drop in confirmed dengue in the trial, not that dengue was wiped out or that it works equally well everywhere. People moving between areas, how well Wolbachia establishes and surveillance quality all affect transfer to other places.
A real surveillance trend. Indonesia’s national reports of dengue haemorrhagic fever give incidence per 100,000 people of about 24.8 (2018), 51.0 (2019), 40.0 (2020), 27.0 (2021) and 52.1 (2022). Because these are rates, years can be compared even as the population grows. The rise and fall from year to year is typical of dengue, which changes with weather, mosquito numbers and which serotype is circulating. Indonesian Ministry of Health, InfoDATIN dengue report 2023, Figure 2.
Immunity and the reproduction number
The basic reproduction number (R₀) is the average number of people one case infects when everyone is susceptible. The effective reproduction number (Rₑ) allows for immunity. For a simple directly spread infection:
Rₑ ≈ R₀ × S/N, where S/N is the fraction still susceptible.
- R₀ = 3, 40% susceptible: Rₑ ≈ 3 × 0.4 = 1.2. More than one new case each, so spread continues.
- 20% susceptible: Rₑ ≈ 3 × 0.2 = 0.6. Fewer than one, so spread dies out.
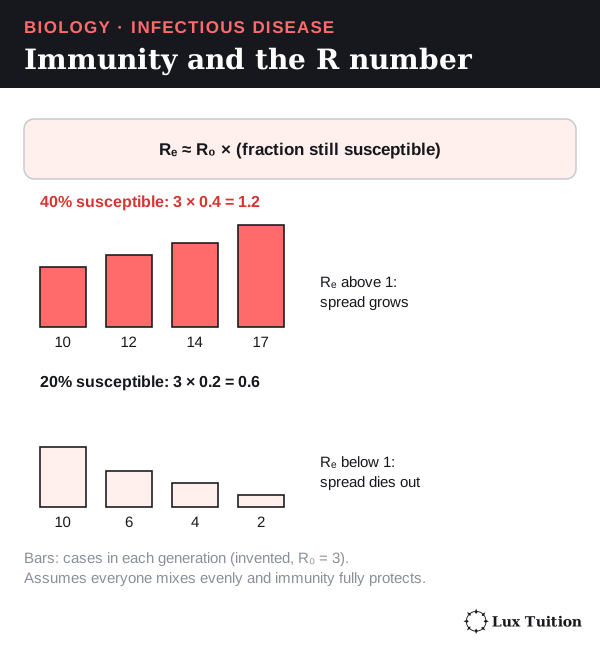
The model assumes even mixing and full protection. Real networks, unvaccinated clusters, travel and fading immunity complicate it, and it does not apply unchanged to dengue’s human–mosquito cycle. See uncertainty and quantitative methods.
How have historical and cultural strategies shaped disease prediction and control?
John Snow and cholera, London 1854
Many people then blamed cholera on “bad air”. During the 1854 outbreak, John Snow investigated drinking water instead.
- Mapping. Deaths clustered around the Broad Street water pump, suggesting a shared source.
- Exceptions. Brewery workers, who drank beer, and residents of a workhouse with its own well had very few deaths.
- Comparing groups. Households supplied by different water companies had different death rates.
The comparison of exposure groups was key: a map shows where cases happened, not why.
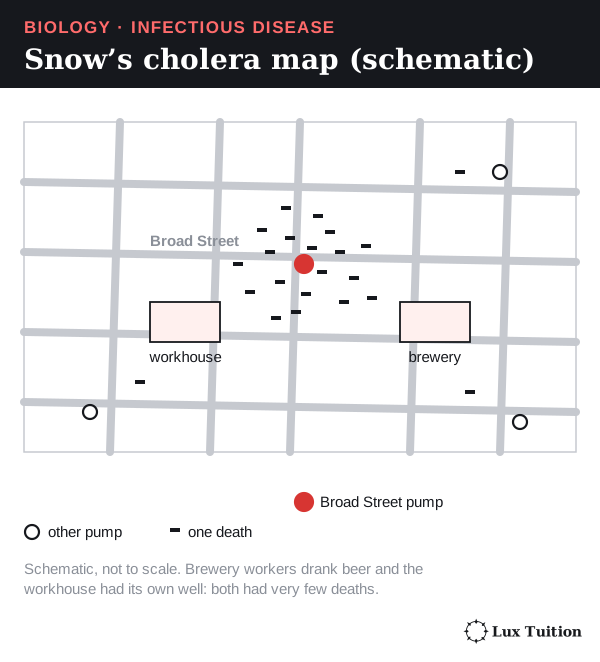
The pump handle was removed, but the outbreak was already declining, so that alone did not prove the cause. Snow’s contribution was combining population data, exposure histories and a testable explanation, before the bacterium’s role was known. CDC: Snow and the Broad Street pump; CDC: historical epidemiology and water-company comparisons.
Current prediction
Today’s predictions combine surveillance with biology:
- Rainfall and temperature forecast mosquito conditions.
- Travel patterns show how disease could arrive.
- Genomic comparisons (comparing pathogens’ genetic material) link cases or rule out a source.
A prediction is only as good as its data and assumptions. An introduced infection spreads only where susceptible hosts and the right conditions exist.
Testing and revising a hypothesis
If you suspect a shared water source but unaffected households use it, or cases share a different exposure, revise the hypothesis. Consistent case definitions, comparison groups and exposure timing relative to symptom onset help decide.
Judging historical and cultural practices
Separating sick people reduces contact even when nobody knows how infection spreads, but an old practice is not automatically safe or effective. Control works best when it combines science and data with local knowledge, trusted communication and community partnership.
Why do Aboriginal protocols matter in developing medicines and biological materials?
bush medicine
smoke bush in Western Australia
Whose knowledge is it?
Aboriginal Peoples hold diverse, place-specific knowledge of plants, medicines and Country. It belongs to particular custodians and communities, not to everyone.
Indigenous Cultural and Intellectual Property (ICIP) is the rights Indigenous peoples hold over their cultural knowledge and its use. Reading a published description, or holding a government collecting permit, does not give custodians’ permission to research, share or profit from that knowledge.
How responsible research works
- Identify the right custodians and agree how decisions are made.
- Obtain free, prior and informed consent: a decision made without pressure, before work starts, with clear information about purpose, methods, risks and uses.
- Agree on control of samples and data, acknowledgement, review of publications, benefit sharing and intellectual property (ownership of ideas and inventions).
- Research under those agreements, following community rules about who speaks for which knowledge and respecting restrictions on disclosure.
- Share benefits: community-directed research, jobs, training and agreed payments.
Consent is ongoing: new uses of samples or commercial plans may need new agreement. Acknowledgement alone does not replace consent or benefit sharing. AIATSIS research ethics framework; AIATSIS Code of Ethics, principles 1.9–1.13.
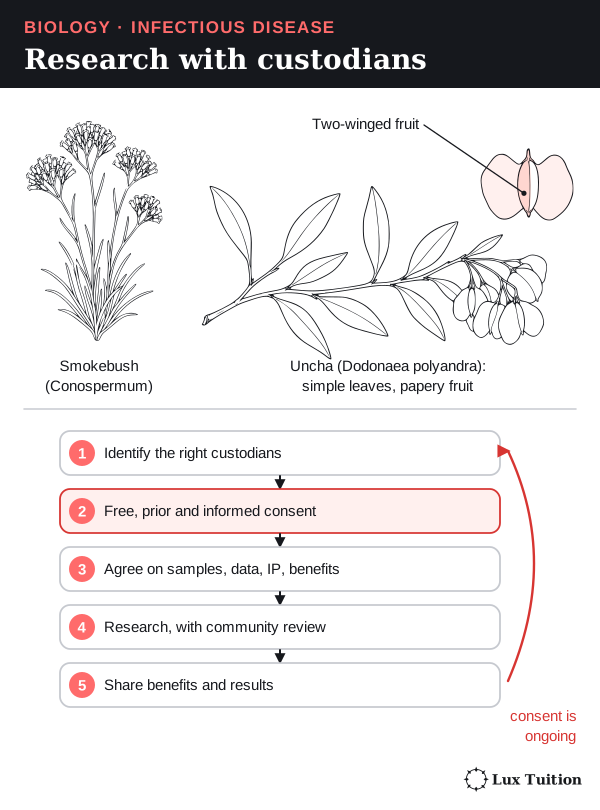
Keep four kinds of evidence apart: a traditional use, a laboratory effect, a safe preparation and a clinically proven treatment.
Bush medicine: Kuuku I’yu knowledge and uncha
Chuulangun Aboriginal Corporation describes research with the University of South Australia on uncha (Dodonaea polyandra), a shrub with simple leaves and papery two-winged fruit. The community’s account explains the role of Kuuku I’yu knowledge and an agreement covering existing and new intellectual property. It is one model of custodians sharing decisions, not a protocol for every community or proof the plant treats infection. Chuulangun Aboriginal Corporation: traditional medicine.
Western Australian smokebush
Research on smokebush (Conospermum species) found a compound, conocurvone, that was active against HIV in laboratory tests. Its history shows why plant collection, traditional knowledge, research rights and benefit sharing must each be considered.
A research agreement and a lab result are not an approved HIV medicine, and smokebush is not a traditional Aboriginal HIV treatment. Queensland Government biodiscovery resource toolkit, smokebush case study; Western Australian Government, historical development agreement, 22 December 1993.
Identifying an active substance needs repeatable evidence; using knowledge and materials needs proper authority and agreements. Neither lab success nor commercial interest removes obligations to knowledge holders.
Working Scientifically skills for Module 7
These are the investigation and data skills HSC questions test through infectious disease. Each one is shown with a Module 7 example.
Questions, hypotheses and changing them
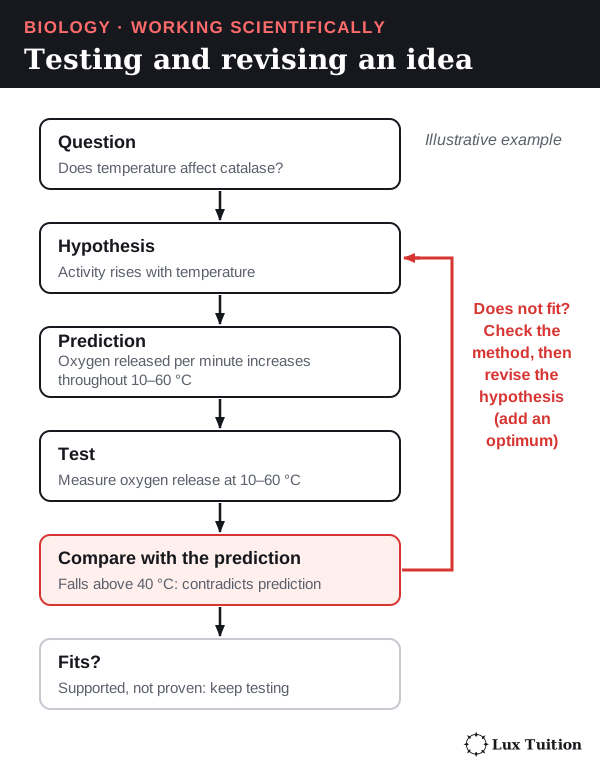
A question names what you want to find out. A hypothesis is a testable statement, usually directional or comparative. A reason (“because…”) makes it stronger but is not essential. A prediction says what result you expect if the hypothesis is right.
- Write the question.
- Write a hypothesis: “If…, then…” (adding “because…” is a good scaffold).
- Test it, then compare the results with the prediction.
- If they do not fit, modify the hypothesis and test again.
Example. Question: does honey slow bacterial growth? Hypothesis: “If bacteria are grown with honey, the zone of inhibition will be larger than with the carrier liquid alone, because honey contains antibacterial substances.” If only one strain is inhibited, revise it to name that strain. John Snow did the same with cholera: when unaffected households used the suspect water, he had to rethink (prediction and history).
In this example, the enzyme catalase breaks down hydrogen peroxide and releases oxygen, so the oxygen made per minute measures its activity.
Variables, controls and replication
- The independent variable (IV) is what you change. The dependent variable (DV) is what you measure. Controlled variables are kept the same.
- An experimental control is a separate set-up that checks the method, such as an uninoculated plate (no bacteria added) or the negative and reference controls in water testing.
- Replication means several independent samples or organisms per condition; re-measuring one sample only checks the measuring.
Example (2020 HSC, microbial growth on foods). IV: food type. DV: microbial growth. A plate of uninoculated agar is the negative control. In a quarantine study (2019 HSC), the quarantine policy is the IV and disease cases are the outcome.
Common mistake: listing ten controlled variables. Name the two or three that could really change the result, such as bacterial strain and starting amount.
Planning: risk, ethics, materials and technology
Plan for safety and fairness before you start:
- Hazard: what could cause harm (for example, unknown microbes growing on plates).
- Risk: the likelihood and severity of harm, and how it could happen (opening a plate releases spores).
- Precaution, with its reason: tape plates shut and incubate at about 25 °C, not body temperature (37 °C), so microbes that grow best in people are less likely to multiply. Dispose of plates by approved sterilisation.
- Ethics: never infect people deliberately; protect health records; get custodians’ consent for Indigenous knowledge (Aboriginal protocols).
- Technology: choose a method that can detect the target. A molecular test detects DNA; a microscope cannot show most viruses.
Common mistake: “wear gloves” with no reason. HSC marks (2024) reward the precaution and how it reduces exposure.
Validity, reliability, accuracy and error
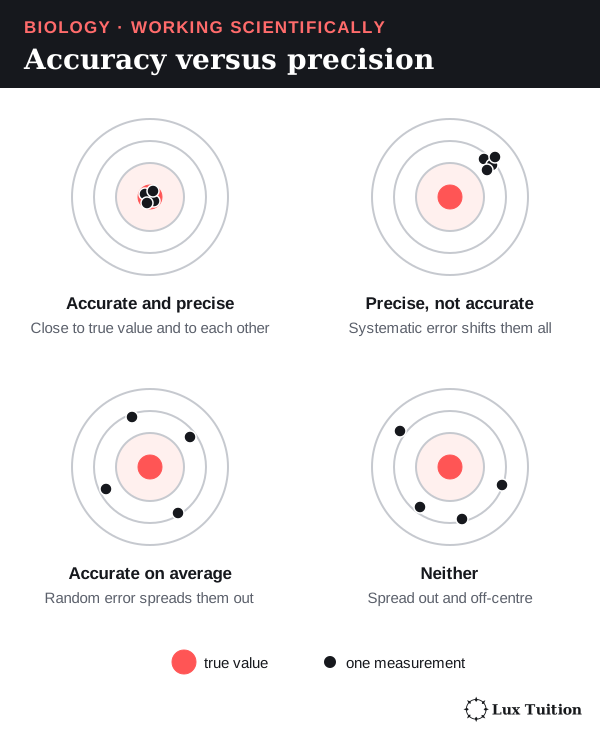
- Valid: the investigation answers the question it claims to. In a controlled experiment that means only the IV changes. An observational study is valid when exposure and outcomes are measured accurately and consistently, comparison groups are matched or adjusted for confounders (other factors that affect the outcome), and follow-up is long enough.
- Reliable: repeated independent trials give similar results.
- Accurate: results are close to the true value. Fix inaccurate instruments by calibration (checking against a known standard).
- Precise: repeated readings are close to each other (small spread). Precise results can still be inaccurate.
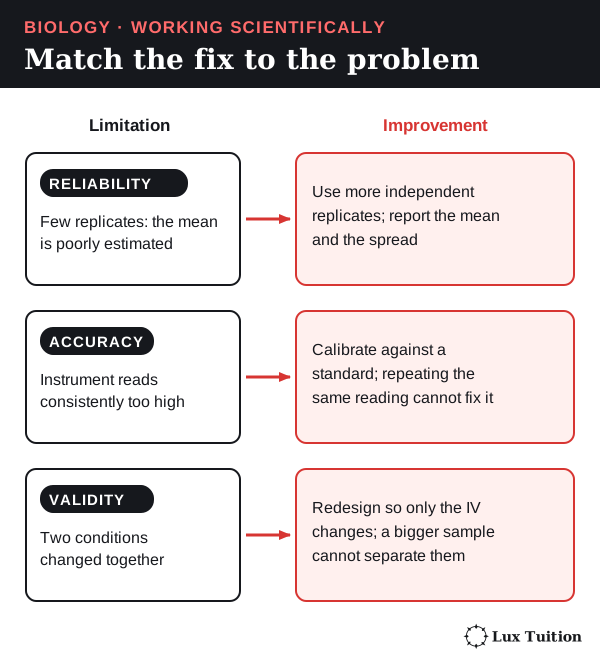
- Random error scatters readings unpredictably; more replicates reduce its effect. Systematic error shifts readings in a consistent way, for example a balance that reads 0.5 g with nothing on it, or one that is always 5% high. Averaging repeats reduces random error but cannot remove systematic bias; that needs calibration or a corrected method.
- Uncertainty is shown by the spread of results: the range (largest minus smallest) or a confidence interval, like the AWED trial’s 65.3–84.9% (disease data). Natural variation between organisms is not poor reliability, and more replicates estimate the mean better without removing that variation.
Example (2022 HSC, testing an antimicrobial, 5 marks). A strong design:
- Spread the same bacterial strain evenly on identical agar plates (validity).
- Place equal-sized discs: one with the substance, one with carrier liquid only (control).
- Incubate all plates at the same temperature and time (validity).
- Measure each zone diameter with a ruler at two right angles and average (accuracy).
- Use at least five plates per treatment and compare means and ranges (reliability).
A bigger sample alone is not “more valid” (2024 HSC); validity comes from the design.
Representing data: tables and graphs
- Table: IV in the first column; headings with quantity and unit, such as “Zone diameter (mm)”.
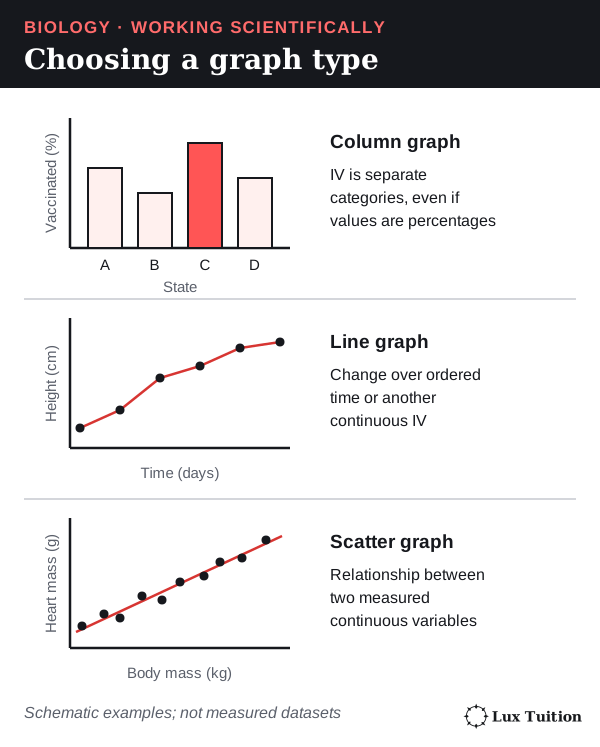
- Choose the graph by the type of IV:
- separate categories (diseases, antibiotics): column (bar) graph, even when the values are percentages (2022 HSC)
- ordered time or another continuous IV: line graph, like the antibody response curve or an epidemic curve
- two measured continuous variables: scatter graph with a line of best fit.
- Axes: IV on the horizontal axis; label each with quantity and unit; even scales that use most of the grid.
- Plot accurately with small crosses; add a key when there is more than one data series.
- Line or curve of best fit: a smooth line through the trend with points balanced either side. For a time series, joining successive observations can show recorded changes. Use a best-fit line or curve when representing an overall relationship or making a prediction, following the question’s instructions.
Interpolation reads a value between measured points. Extrapolation extends the trend beyond them and assumes the trend continues. To extrapolate to a threshold, extend the line of best fit, draw across from the threshold value to the line, then down to the axis.
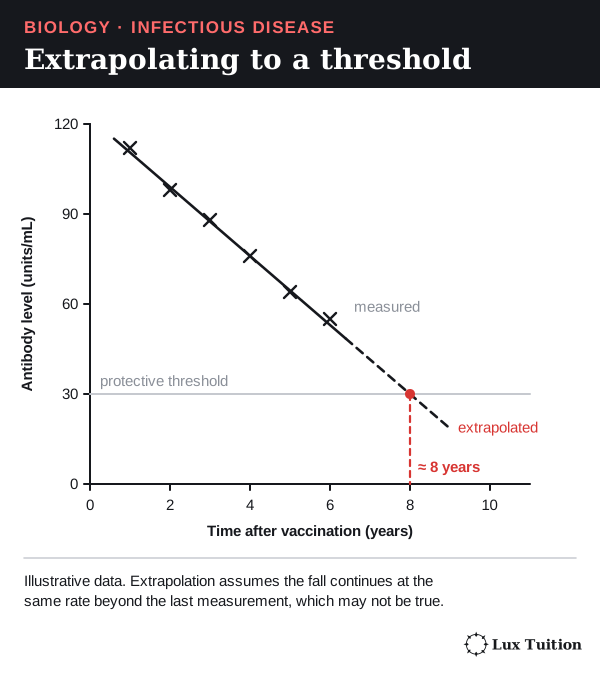
Example. HSC questions on boosters (2023) ask you to judge vaccination against an antibody threshold. A line extended past the data is a prediction, not a measurement. In 2022, a question rewarded comparing age groups only over the time measured, without extrapolating beyond the data.
Common mistake: labelling an axis “antibodies” with no unit, or extrapolating a trend without saying it is an assumption.
Quantitative methods
- Mean = total ÷ number of values. Median = the middle value when ordered. Range = largest − smallest. For zones of 12, 14, 15, 15 and 19 mm (illustrative): mean 15 mm, median 15 mm, range 7 mm.
- Rates per 100,000 let you compare populations of different sizes: rate = cases ÷ population × 100,000. 520 cases in 1,000,000 people is 52 per 100,000, close to Indonesia’s 2022 dengue rate (disease data).
- Converting a percentage to a count: 9.4% of 3,401 clinic patients ≈ 320 people.
- Percentage change = (new − old) ÷ old × 100. A fall from 20% to 15% vaccinated is a drop of 5 percentage points, but a 25% percentage change.
- Absolute numbers versus proportions: the share of a population at risk of malaria can fall while the number of people at risk rises, because the population grew (2019 HSC).
Common mistake: comparing raw case counts between a city and a country, or confusing percentage points with percentage change.
Trends, causes and models
Describe a trend with numbers (“cases rose from 24.8 to 51.0 per 100,000”). Explain it with a mechanism. An association (two things changing together) is not proof of cause: deaths falling after vaccination began supports, but does not prove, that vaccination caused the fall (2025 HSC). Matched comparison groups, a dose–response pattern and a known mechanism make a causal claim stronger.
A model simplifies reality to explain or predict, such as the R number formula or the three-location immune model. State its assumptions: Rₑ ≈ R₀ × S/N assumes even mixing and full protection.
Secondary sources and arguments
Judge a source by who wrote it, how the data were collected, whether it was peer reviewed, its date, and whether it fits your question. Corroboration means separate studies with their own data agree.
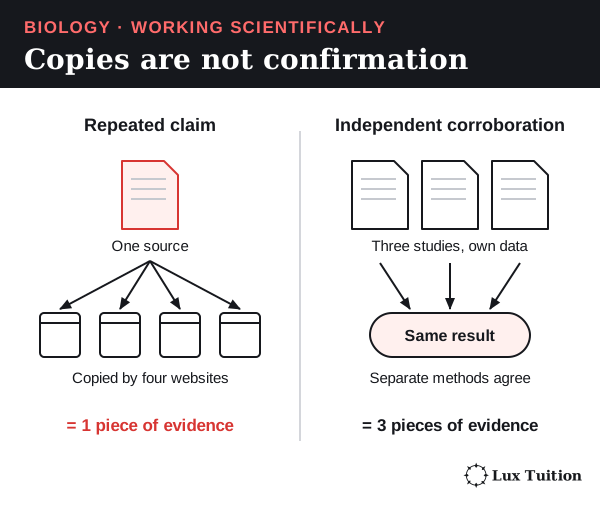
Reference sources by author, year, title and where to find them, as the links on this page do.
An evidence-based argument has a claim, evidence, a mechanism and a limitation. For example: Wolbachia releases reduced confirmed dengue (claim) by 77.1% in the Yogyakarta trial (evidence), because Wolbachia reduces dengue virus replication in mosquitoes (mechanism), but this was one city (limitation). When someone criticises your conclusion, answer with evidence, or change your view if their evidence is stronger.
Command words: what each answer needs
These answer shapes are guides, not formulas: what a question needs depends on its wording and the evidence. See the NESA glossary.
| Command word | What to write | Module 7 example |
|---|---|---|
| Identify | Name it | Identify the vector for malaria. |
| Describe | Features, no reasons | Describe the antibody curve after a second exposure. |
| Explain | Cause and effect: “because”, “so” | Explain why the secondary response is faster. |
| Analyse | Break into parts; show relationships or trends with evidence | Analyse the epidemic curve. |
| Discuss | Considerations and evidence on more than one side, then a conclusion | Discuss the use of quarantine. |
| Compare | Similarities and differences, when asked to compare | Compare active and passive immunity. |
| Assess | Judge value, with evidence | Assess quarantine for controlling Ebola. |
| Evaluate | A judgement backed by evidence, normally strengths and limitations | Evaluate antibiotics for treating infection. |
| Justify | Support a choice with reasons (a justified rejection needs no invented advantage) | Justify the choice of control in a honey test. |
Common mistake: answering “evaluate” with only advantages when the evidence also shows limitations.
Where do these ideas connect across Year 12 Biology?
To compare infectious disease with homeostasis and non-infectious disease, see Module 8: Non-infectious Disease and Disorders. The other Year 12 notes are:
Return to the HSC Biology notes overview for course navigation and shared scientific skills.
Biology tutoring in Blacktown
Our Year 12 Biology classes in Blacktown work through these ideas step by step and give feedback on how students use them in exam answers. Classes have 1–5 students. See current pricing or enquire about a free trial.
Learn it properly with a specialist tutor at Blacktown or online across NSW. Enquire about a free trial — no cost, no obligation. See online formats and class sizes.
Realistic study tips to help you prepare better for assessments with less stress, plus a printable study planner