
These HSC Biology Module 8 notes cover Non-infectious Disease and Disorders in the NSW Year 12 course. They cover homeostasis, causes and effects of disease, epidemiology, prevention and technologies that assist organ function.
Part of our HSC Biology notes. These notes follow the Biology Stage 6 Syllabus (2017) for the 2026 and 2027 HSC. The new syllabus is first examined in 2028.
The Working Scientifically skills for Module 8 at the end of this page cover investigation design, data and evidence. The HSC Biology past-papers guide provides official papers and marking guidelines.
Key Takeaways
- Homeostasis keeps conditions around your cells (temperature, water, blood sugar or glucose) within a safe range, mostly by negative feedback: a response that cancels out the change that triggered it.
- Non-infectious diseases are not caught from others. Their causes can be genetic, environmental or nutritional, and often several factors act together.
- Epidemiology compares disease in populations using incidence (new cases), prevalence (all existing cases) and mortality (deaths). How strong the evidence is depends on the study design, and on the limits of what it can show.
- Hearing, vision and kidney technologies each help one part of a failing pathway. Each works only if the parts after it still work, and each has limitations.
This module asks two big questions. How does a healthy body keep its inside steady? And what happens, and what can we do, when that goes wrong in a disease that does not itself spread from person to person as an infection?
Start here: ideas the whole module uses.
- A cell is the smallest living unit. Your body is built from trillions of them. A thin, flexible membrane surrounds each cell and controls what enters and leaves. Most cells have a nucleus, the cell’s control centre.
- DNA is the chemical in the nucleus that stores the cell’s instructions. A gene is a section of DNA that carries instructions, usually for making a protein.
- A protein is a large molecule built from a chain of smaller units called amino acids. Proteins do most of the work in cells: enzymes, channels in membranes and many hormones (chemical messengers, such as insulin) are proteins.
- An enzyme is a protein that speeds up a chemical reaction in a cell. Enzymes only work well within a narrow range of temperature and pH (how acidic a fluid is).
- Diffusion is the spreading of particles from where they are more concentrated to where they are less concentrated. It needs no energy.
- Osmosis is the diffusion of water across a membrane, from the side with less dissolved substance to the side with more.
- A hormone is a chemical messenger. A gland releases it into the blood, and it changes the activity of the cells it reaches.
- An organ is a body part made of several tissues working together, such as the liver or the pancreas, which both help control blood glucose.
The module then links non-infectious disease to population data, prevention and the technologies that help when an organ stops working well.
How is an organism’s internal environment maintained in response to a changing external environment?
How does negative feedback maintain homeostasis?
What is the internal environment?
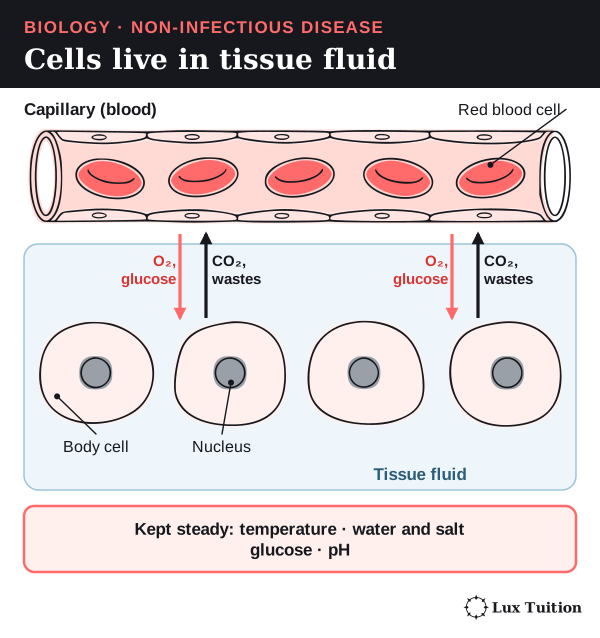
Your cells do not touch the outside world. Each one sits in a thin film of watery fluid called tissue fluid (extracellular fluid, the fluid outside cells). Blood flowing through tiny vessels called capillaries keeps topping this fluid up. This fluid is the internal environment.
The conditions in that fluid decide whether cells can work:
- Temperature. Too hot and proteins (including enzymes) and membranes are damaged. Too cold and enzyme-controlled reactions slow down.
- Water and dissolved substances. If the fluid is too salty or too dilute, water rushes out of or into cells by osmosis.
- pH and glucose. These affect enzyme activity and cellular respiration (the process that releases energy from glucose).
What is homeostasis?
Homeostasis is keeping the internal environment within a range that cells can tolerate, even when conditions outside change. It is a dynamic balance, not a frozen value. For example, blood glucose (sugar) rises after a meal, and then the body brings it back down.
Three terms describe the target:
- A set point is the value the body regulates around, such as about 37 °C for core body temperature.
- The normal range is the small band of values around the set point that the body keeps a variable within.
- A tolerance range is the wider band in which the organism can survive and keep working. Near its edges the organism is stressed, so corrective responses start well before those limits.
The parts of a control system
Every homeostatic response uses the same set of parts. Learn these words: exam questions expect them.
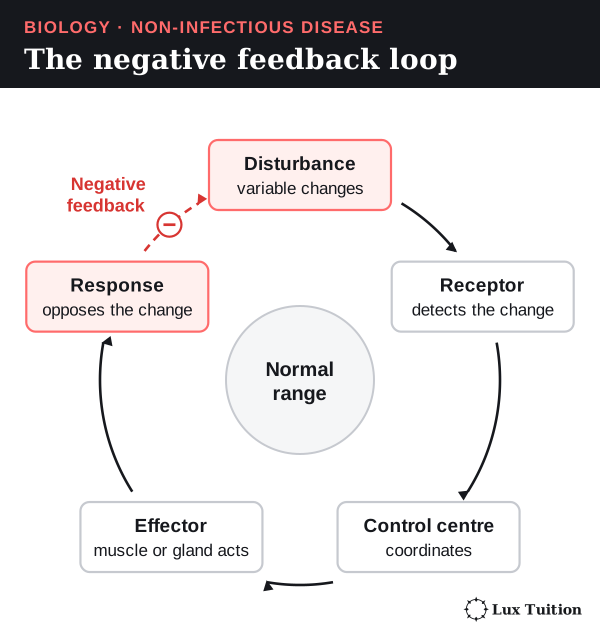
- A stimulus is a change in a variable that the body can detect, such as a rise in body temperature.
- A receptor is a cell or structure that detects the stimulus.
- A control centre (often the brain, or a gland) compares the information with the set point and decides on a response.
- An effector is a muscle or gland that carries out the response.
- The response is the action that changes the variable, such as sweating.
Negative feedback
Negative feedback means the response reduces, or opposes, the original change. If a variable rises, the response lowers it. If it falls, the response raises it. As the variable returns to normal, the stimulus shrinks, so the response also shrinks and switches off.
“Negative” describes the direction (it opposes the change). It does not mean the response is bad.
Think of it like a heater with a thermostat: the heater turns on when the room is cold and off once it is warm. Unlike a thermostat, though, the body usually runs several opposing responses at once and adjusts them smoothly rather than just on or off.
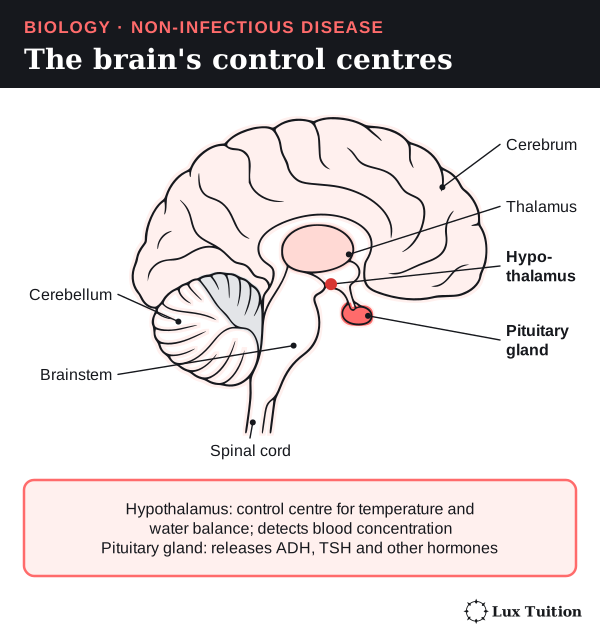
The control centre is not always the brain. The hypothalamus, a small region at the base of the brain, controls body temperature. But for blood glucose, cells in the pancreas both detect the change and release the hormones. No separate command from the brain is needed for that loop.
Reading homeostasis on a graph
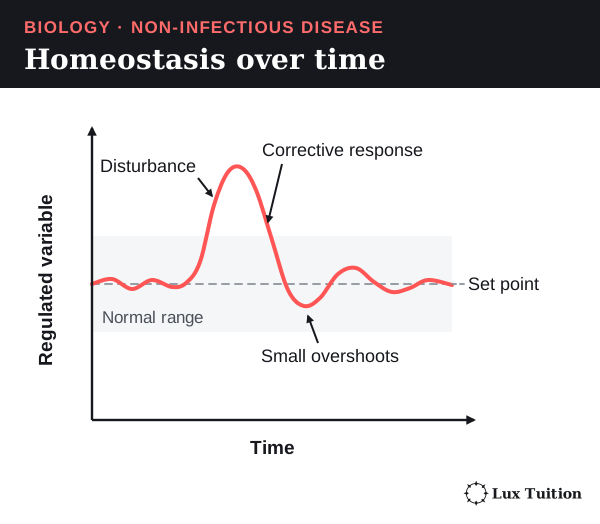
On a graph of a regulated variable over time, homeostasis looks like this:
- The variable wobbles a little around the set point, inside the normal range.
- A disturbance pushes it away from the set point.
- A corrective response brings it back. Because responses take time to start and stop, the value may overshoot slightly before settling.
A flat line on its own does not prove negative feedback. To show negative feedback you need evidence of all three links: a disturbance, a response that opposes it, and that response fading once the variable is back to normal.
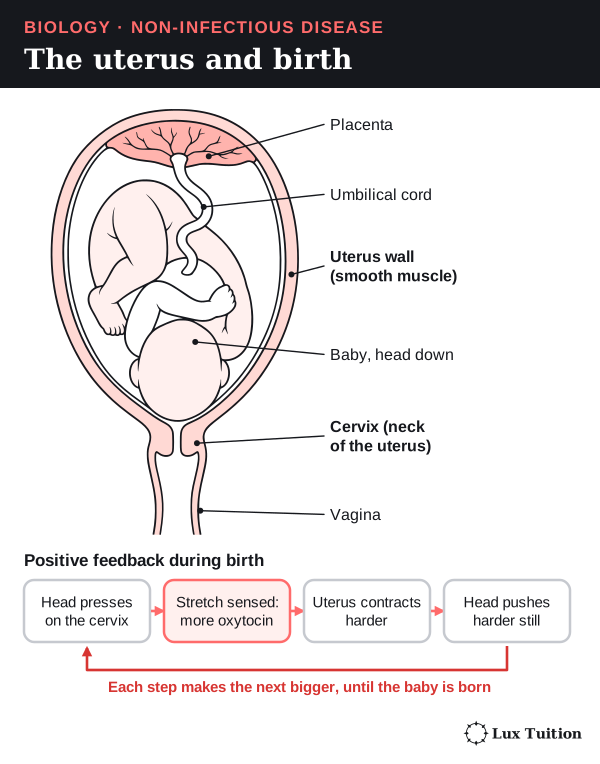
Positive feedback is the opposite: the response makes the change bigger. An example is childbirth. The uterus (womb) is the muscular organ in which a baby develops, and its lower neck is the cervix. As the baby’s head presses on the cervix, the hormone oxytocin is released. Oxytocin strengthens the contractions of the uterus, which press the head harder on the cervix, which releases more oxytocin. Positive feedback drives a process to an end point. It does not keep conditions steady.
How do humans regulate body temperature?
temperature (ACSBL098)
Humans are endotherms: animals that make most of their body heat themselves, from the chemical reactions of metabolism (all the reactions in the body’s cells). We keep our core temperature close to 37 °C whether the air is freezing or hot.
The parts of the temperature control system
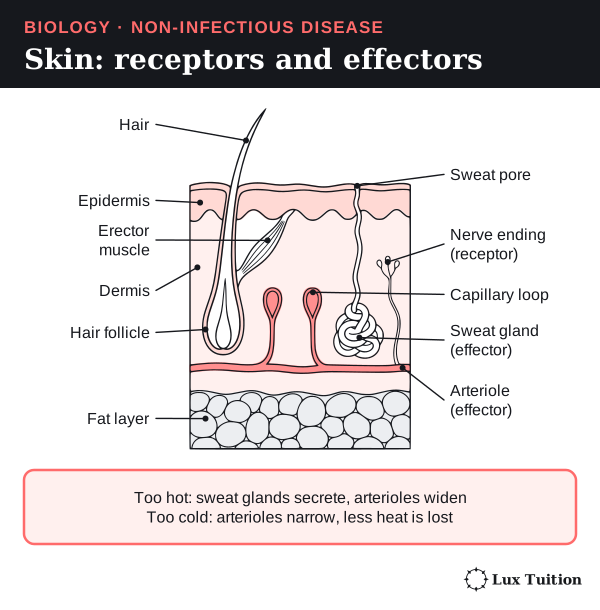
- Receptors. Thermoreceptors are nerve endings that detect temperature. Ones in the skin detect warming or cooling outside. Temperature-sensitive cells in the hypothalamus detect the temperature of the blood (the core).
- Control centre. The hypothalamus compares this information with the set point and sends out commands.
- Effectors. Sweat glands, the smooth muscle in the walls of skin arterioles (small arteries), and skeletal muscles (for shivering).
Because the skin reports outside changes, the body can respond early, before the core temperature has changed much.
Responses that cool you down or warm you up
| Disturbance | Response | How it opposes the disturbance |
|---|---|---|
| Core temperature rises | Sweat glands secrete more sweat | Water in sweat needs energy to evaporate, and it takes that energy from the skin as heat. Sweat that drips off without evaporating cools much less. |
| Core temperature rises | Skin arterioles widen (vasodilation) | More warm blood flows near the surface, so more heat passes to cooler surroundings. |
| Core temperature falls | Skin arterioles narrow (vasoconstriction) | Less blood flows near the surface, so less core heat is lost to the surroundings. |
| Core temperature falls | Skeletal muscles shiver | Rapid, involuntary contractions use more ATP (the cell’s energy carrier), and that releases heat. |
| Long cold exposure | Metabolic and hormone responses support heat production | Thyroid hormones raise metabolic activity. Brown fat (brown adipose tissue) can make heat without muscle contraction. |
Here is the cooling loop as a chain:
temperature rises → receptors detect it → hypothalamus coordinates → sweating and vasodilation → more heat lost → temperature falls → cooling responses switch off.
The warming loop runs the same way, with responses that reduce heat loss and increase heat production.
How heat moves between the body and its surroundings
Heat moves in four ways:
- Conduction: through direct contact, such as skin touching cold water.
- Convection: carried away by moving air or water.
- Radiation: given off as electromagnetic waves (infrared), with no contact needed.
- Evaporation: removed when liquid water turns into vapour.
The first three can warm you as well as cool you, depending on whether what touches, moves past or surrounds your skin is hotter or colder than it. If the air is hotter than your skin, sending more blood to the skin cannot guarantee cooling by these “dry” routes, so evaporation is often the main way left to cool down. Humid air already holds a lot of water vapour, so sweat evaporates more slowly and cools you less.
Costs and limits
Regulation has costs. Sweating uses up body water, and shivering uses up energy. Saving water by sweating less can let body temperature rise. Homeostasis only works while the responses can keep up with the disturbance. OpenStax: energy and heat balance.

How do insulin and glucagon regulate blood glucose?
glucose
Cells use glucose as fuel for cellular respiration. Too little glucose in the blood starves cells, especially brain cells. Too much damages blood vessels and nerves over time. So blood glucose is kept within a narrow range.
Three similar-sounding words cause many lost marks. Keep them apart:
- Glucose is a small, soluble sugar that cells use as fuel. It is carried dissolved in plasma, the liquid part of blood.
- Glycogen is a large storage carbohydrate made by joining many glucose molecules. The liver and muscles store it.
- Glucagon is a hormone. It is a signal, not a sugar.
Where the hormones come from
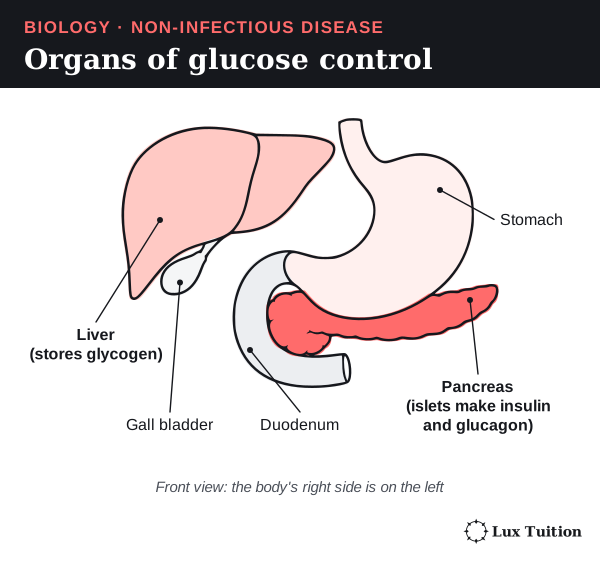
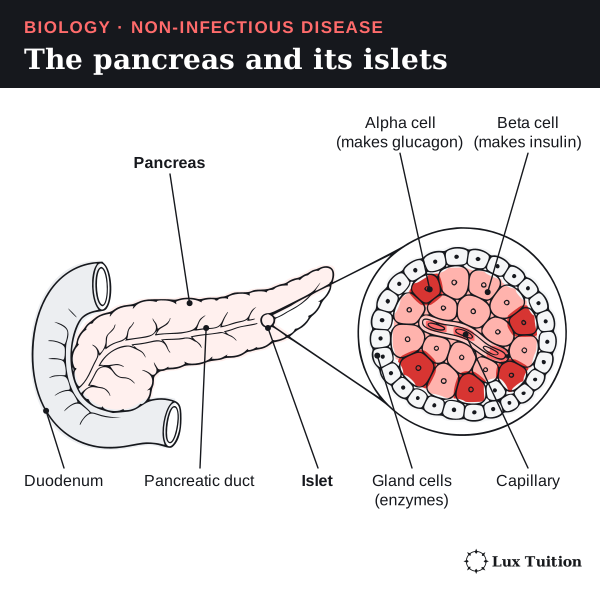
The pancreas is an organ that lies behind the stomach, in the curve of the duodenum (the first part of the small intestine). Most of it makes digestive enzymes, but small clusters of hormone-making cells called islets (islets of Langerhans) are scattered through it. Islets contain two cell types:
- Beta cells release insulin when blood glucose rises.
- Alpha cells release glucagon when blood glucose falls.
The liver is the large organ in the upper right of the abdomen. It is the main target of both hormones because it can store glucose as glycogen and release glucose back into the blood.
When blood glucose rises (after a meal)
- Digested carbohydrate is absorbed, so glucose enters the blood.
- Beta cells detect the rise and release more insulin.
- Insulin travels in the blood and binds to receptors (protein “docking sites” for a hormone) on target cells.
- The targets respond:
- Skeletal muscle and fat (adipose) tissue take up more glucose.
- The liver and muscles join glucose into glycogen.
- The liver releases less glucose into the blood.
- Blood glucose falls, so the stimulus for insulin release shrinks (negative feedback).
When blood glucose falls (between meals)
- Alpha cells detect the fall and release more glucagon.
- Glucagon acts mainly on the liver. The liver breaks glycogen down into glucose. It also makes new glucose from non-carbohydrate substances (such as some amino acids).
- The liver releases this glucose into the blood.
- Blood glucose rises, so the stimulus for glucagon release shrinks.
Muscle glycogen is used by the muscle itself. Unlike liver glycogen, it does not top up blood glucose directly.
The hormones do not turn into glucose or glycogen themselves. They are signals that change what enzymes and transport proteins in the target cells do. Not every cell needs insulin to take in glucose. OpenStax: hormonal regulation.
When the loop fails: diabetes
Diabetes is a group of conditions in which blood glucose stays too high. High blood glucose is called hyperglycaemia.
- In type 1 diabetes, the immune system destroys the beta cells. Very little insulin is made. It is not caused by eating sugar.
- In type 2 diabetes, target cells respond less to insulin (insulin resistance). Over time the beta cells cannot make enough extra insulin to make up for it. Genes, age, activity, body fat and diet all play a part, not one food choice.
Both types lead to hyperglycaemia, but through different broken links in the loop.
Very high blood glucose also affects the kidneys:
Healthy kidneys filter glucose out of the blood and then take all of it back. If there is more glucose than the kidney tubules (the tiny tubes that process the filtered fluid) can take back, some stays in the urine and holds water with it, so the person passes more urine and feels thirsty. This is an exceeded reabsorptive capacity (the kidney’s limit for taking substances back), not a failure to stop glucose being filtered. Over years, high glucose damages blood vessels and nerves, which links diabetes to eye and kidney disorders later in this module. NIDDK: insulin resistance.

How do behavioural, structural and physiological adaptations help endotherms?
trends and patterns in behavioural, structural and physiological adaptations in endotherms that assist in maintaining homeostasis (ACSBL099, ACSBL114)
An adaptation is an inherited feature that helps an organism survive and reproduce in its environment. Adaptations build up over many generations through natural selection: individuals with helpful inherited features survive and reproduce more, so those features become more common. An animal that simply changes its posture, or slowly gets used to a hot climate (acclimatising), has not evolved a new inherited trait in its lifetime.
There are three kinds. Learn to sort examples into them:
- Behavioural: something the animal does, such as seeking shade or curling up.
- Structural: a body feature, such as thick fur or large ears.
- Physiological: a body process, such as sweating or changing blood flow.
Different kinds often work together, and each one has a cost.
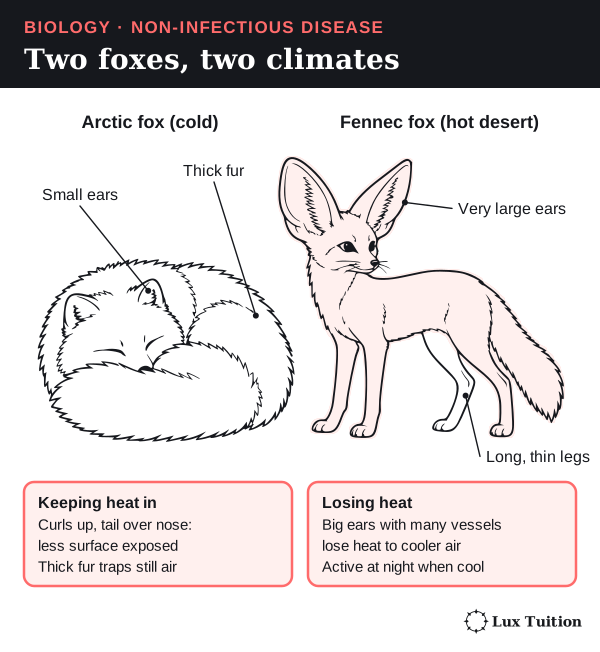
| Adaptation | How it works, and its cost |
|---|---|
| Seeking shade, burrowing or being active when it is cooler: behavioural | Avoids heat without spending water on sweating or panting. Cost: less time to feed. |
| Huddling or curling up: behavioural | Less body surface is exposed to cold air and wind. The animal still has to make heat. |
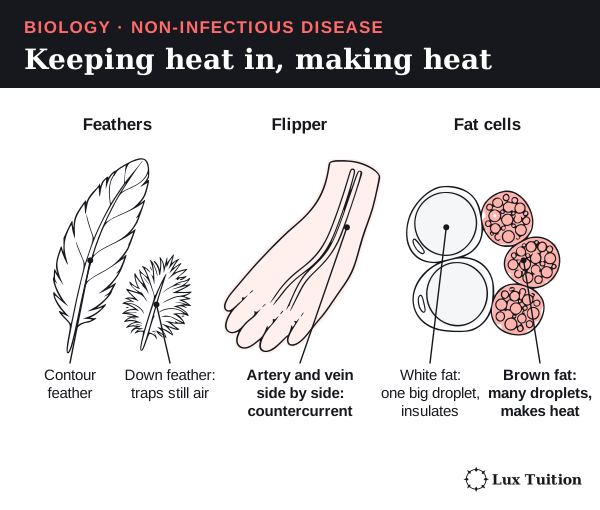
| Fur, feathers and fat under the skin: structural | Trapped air and fat slow heat transfer (they insulate). Cost: thick insulation makes it harder to lose heat when it is hot. |
| Large ears with many blood vessels: structural | Give a big surface for losing heat when the air is cooler than the blood. |
| Panting, sweating or licking fur: physiological or behavioural | Evaporation cools wet surfaces. Cost: uses water, and works less well in humid air. |
| Vasoconstriction and countercurrent heat exchange: physiological and structural | Less blood reaches the surface, or heat is passed from warm outgoing blood to cool returning blood (explained below), keeping heat in the core. |
| Torpor: physiological | A controlled drop in metabolism and body temperature saves energy when food is short. Cost: the animal is slow and less alert. |
Brown fat (brown adipose tissue) is a special fat tissue packed with many small fat droplets and mitochondria (the parts of a cell where energy is released from food). It releases energy as heat instead of storing it, which is why it helps newborns and hibernating animals keep warm. Ordinary white fat stores energy in one big droplet per cell and mainly insulates.
Surface area to volume ratio
Heat is lost through the body’s surface, but it is made and stored in the body’s volume. The surface-area-to-volume ratio (SA:V) compares the two.
Work through the cube example in the next figure:
- A 1 cm cube has a surface area of 6 cm² and a volume of 1 cm³. Its SA:V is 6:1.
- A 2 cm cube has a surface area of 24 cm² and a volume of 8 cm³. Its SA:V is 3:1.
- Doubling every length multiplied the area by 4 but the volume by 8, so the ratio halved.
So, for similarly shaped bodies, a smaller endotherm tends to lose heat faster relative to its mass and needs a higher mass-specific metabolic rate (more energy released per gram).
Countercurrent heat exchange
In the legs of some animals (and the flippers of others), the artery carrying warm blood out runs right next to the vein bringing cool blood back. Heat passes from the warm artery to the cool vein along their whole length. The blood reaching the foot is already cooler, so less heat is lost there, and the heat is carried back into the core.
Trends, not laws
- Bergmann’s rule: in some groups of endotherms, populations in colder places tend to have larger bodies (a smaller SA:V).
- Allen’s rule: in colder places, appendages such as ears, legs and tails tend to be shorter.
These are trends, not laws. Food supply, evolutionary history and behaviour also matter. Comparing two unrelated species cannot prove that temperature alone caused a difference in size.

How do neural pathways and hormones coordinate homeostasis?
internal coordination systems that allow homeostasis to be maintained, including hormones and neural pathways (ACSBL112, ACSBL113, ACSBL114)
The body has two systems for sending messages between its receptors, control centres and effectors. The nervous system sends fast electrical signals along nerve cells. The endocrine system sends hormones through the blood. Homeostasis uses both.
Receptors: what they detect
A receptor detects a stimulus, and an effector carries out a response. Receptors are named after what they detect:
- Thermoreceptors detect temperature.
- Chemoreceptors detect chemicals, such as glucose or carbon dioxide.
- Mechanoreceptors detect pressure, stretch or movement.
- Photoreceptors detect light.
- Osmoreceptors detect changes in how concentrated the body fluids are (their solute concentration: how much dissolved material they hold).
Blood-pressure receptors are a kind of mechanoreceptor. They detect the stretch of blood vessel walls, not how concentrated the blood is.
How the nervous system is organised
- The central nervous system (CNS) is the brain and spinal cord. It processes information and sends out commands.
- The peripheral nervous system (PNS) is all the nerves outside the brain and spinal cord. Its nerve cells are called neurons (described in detail below).
- Sensory neurons are peripheral neurons that carry signals from receptors to the CNS.
- Interneurons sit inside the CNS and connect neurons to each other.
- Motor neurons are peripheral neurons that carry commands from the CNS to effectors (muscles and glands).
Motor pathways come in two kinds. Autonomic pathways (not under conscious control) control glands and smooth muscle, such as the muscle in arteriole walls. Somatic pathways control skeletal muscles, including the muscles that shiver.
The neuron
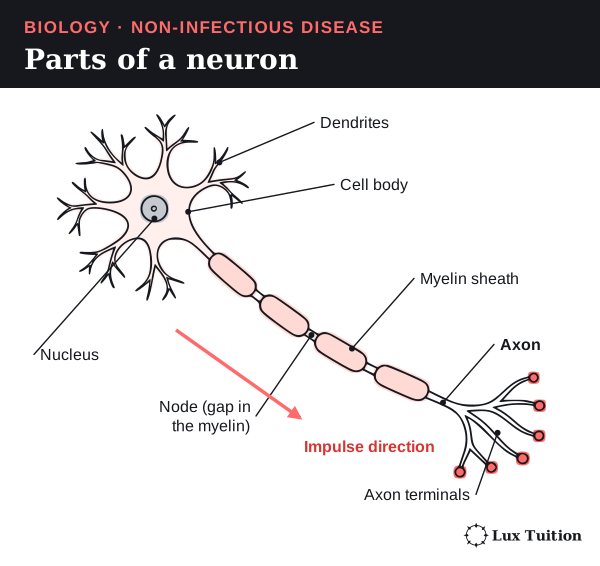
A neuron is a nerve cell: a cell built to carry electrical signals over long distances. Its parts:
- Dendrites are short branches that receive signals from other cells.
- The cell body contains the nucleus and keeps the cell alive.
- The axon is a long, thin extension that carries the signal away from the cell body.
- The myelin sheath is a fatty wrapping around the axon. It insulates it, and the signal jumps between the small gaps (nodes) in the myelin, which makes it much faster.
- Axon terminals at the end pass the signal on to the next cell.
The impulse (an action potential, explained below) starts at the axon hillock, the part of the cell body where the axon begins. In experiments an axon stimulated in the middle can conduct both ways; synapses keep the normal direction.
The action potential: the nerve signal
An action potential (a nerve impulse) is a very fast change in the voltage across the neuron’s membrane, caused by charged particles (ions) moving through it.
- At rest, the inside of the neuron is negative compared with the outside.
- When a stimulus pushes the voltage past a trigger level called the threshold, sodium channels open. Sodium ions (Na⁺) rush in, and the inside becomes positive. This is depolarisation.
- The sodium channels then close and become inactivated (they cannot reopen straight away), and potassium ions (K⁺) flow out. The inside becomes negative again (repolarisation). Inactivation also stops the impulse travelling backwards.
- Protein pumps in the membrane keep restoring the ion differences that make the next action potential possible.
Every action potential in a neuron is the same size. A stronger stimulus causes more action potentials per second (a higher frequency) and triggers more neurons, not bigger action potentials.
The synapse: passing the signal on
A synapse is the junction between a neuron and the next cell. At a chemical synapse the two cells do not touch: a tiny gap, the synaptic cleft, separates them.
- An action potential arrives at the axon terminal.
- The terminal releases a chemical called a neurotransmitter.
- The neurotransmitter diffuses across the cleft.
- It binds to receptors on the next cell. This can make that cell more likely to fire (excitatory) or less likely (inhibitory).
- The neurotransmitter is then removed or broken down, so the signal stops.

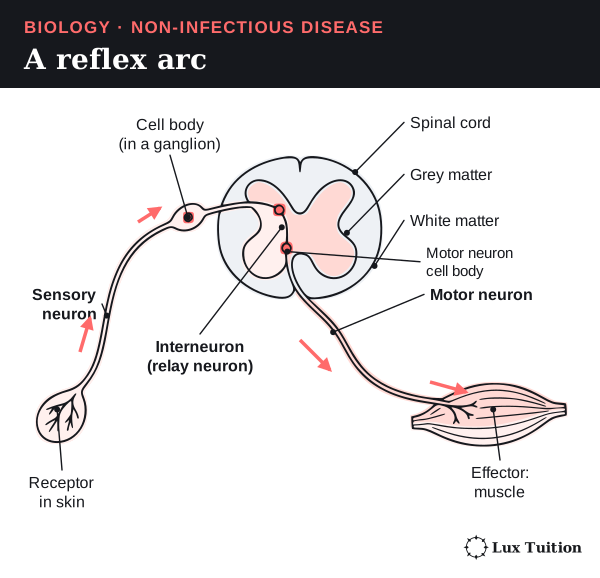
Reflexes
A reflex is a fast, automatic response to a stimulus, such as pulling your hand off a hot pan. The pathway it uses is a reflex arc:
receptor → sensory neuron → interneuron in the spinal cord → motor neuron → effector (muscle)
Because the decision is made in the spinal cord, the response does not wait for the brain to think about it. Information still travels up to the brain, which is why you feel the pain a moment later. OpenStax: neural signalling.
Hormones and the endocrine system
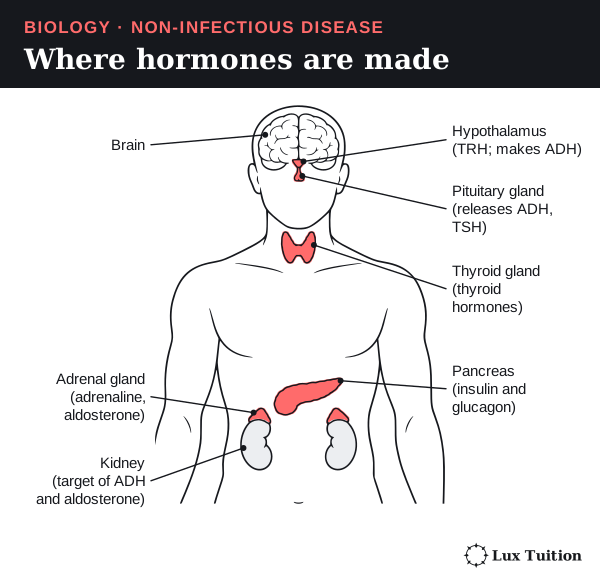
An endocrine gland is a gland that releases hormones straight into the blood. Hormones travel all around the body, but only target cells respond. Target cells are the cells that have the right receptor for that hormone.
- Water-soluble hormones, such as insulin, cannot pass through the cell membrane. They bind to receptors on the cell surface, which set off signals inside the cell.
- Lipid-soluble (fat-soluble) hormones, such as steroid hormones, pass through the membrane. They bind to receptors inside the cell and often switch genes on or off.
The same hormone can cause different effects in different tissues.
| Comparison | Nervous coordination | Endocrine coordination |
|---|---|---|
| Route | Action potentials along neurons; neurotransmitter across synapses | Hormones carried in the blood |
| How targets are chosen | Which cells the neurons connect to, and their receptors | Only cells with the matching hormone receptor |
| Typical speed | Fast, and the effect is usually brief | Usually slower and longer lasting (with exceptions) |
| Example | Nerves widening or narrowing skin arterioles | Insulin changing how tissues handle glucose |
The two systems work together
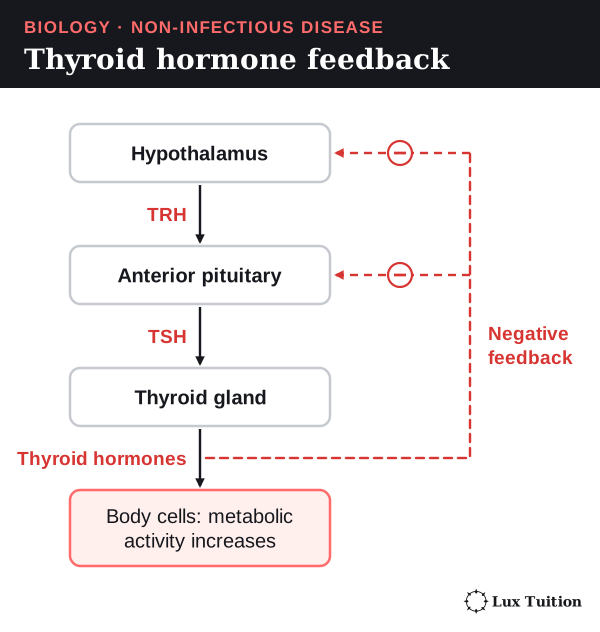
The hypothalamus links the nervous and endocrine systems. It receives nerve signals and controls the pituitary gland. The thyroid control chain is a good example:
- The hypothalamus releases TRH (thyrotropin-releasing hormone).
- TRH makes the anterior (front) pituitary release TSH (thyroid-stimulating hormone).
- TSH makes the thyroid gland release thyroid hormones, which raise metabolic activity.
- High thyroid hormone levels feed back to reduce TRH and TSH release (negative feedback).
Hormones add to fast nerve responses. They do not replace them.
How does ADH regulate water balance?
Water comes into the body from drinking, from food and from metabolic reactions. It leaves in urine, in faeces, and by evaporation from the skin and lungs. Gains and losses must stay roughly balanced. Otherwise cells swell or shrink by osmosis, and blood volume changes.
Start here: the kidneys
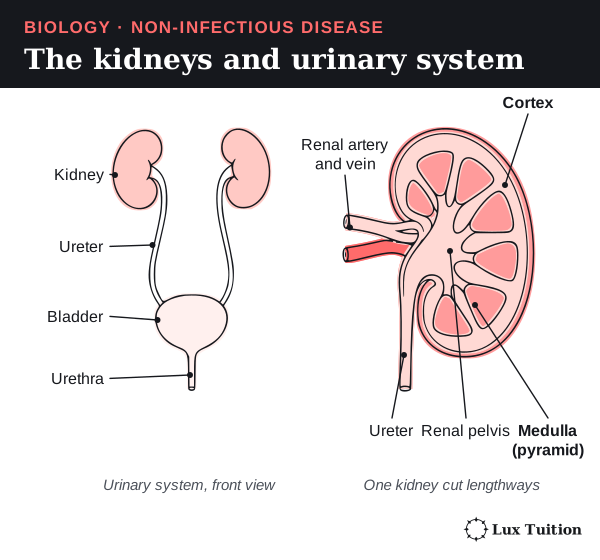
The kidneys are two bean-shaped organs at the back of the abdomen. They filter the blood, remove wastes and adjust how much water and salt the body keeps. The liquid they produce, urine, drains down a tube called the ureter to the bladder, which stores it. Urine leaves the body through the urethra.
Inside each kidney are about a million tiny tubes called nephrons. The last part of each tube, the collecting duct, is where the body decides how much water to keep. The kidney section later in this module looks at the nephron in detail.
The ADH loop when you are short of water
Antidiuretic hormone (ADH) is a hormone that makes the kidneys keep more water. (“Antidiuretic” means “against making lots of urine”.)
- Stimulus: after a lot of water is lost, for example by sweating, the blood plasma becomes more concentrated.
- Receptors: osmoreceptors in the hypothalamus detect the change.
- Response from the control centre: the posterior (back) pituitary releases more ADH into the blood. ADH is made by nerve cells in the hypothalamus, then stored in and released from the posterior pituitary.
- Effector: in the kidneys, ADH makes collecting-duct cells add more aquaporins to their membranes. Aquaporins are protein channels that let water through.
- Result: more water moves by osmosis out of the collecting duct into the salty surrounding tissue, and from there back into the blood. Less urine is made, and it is more concentrated.
- Feedback: as the plasma concentration returns to normal, ADH release falls.
When you drink too much water
The opposite happens. Plasma becomes more dilute, so less ADH is released. The collecting ducts let less water through, and a large volume of dilute urine is made.
ADH controls how much water is reabsorbed (taken back into the blood). It does not make water. Thirst works alongside it by making you drink more. The figure below shows the feedback loop on the left and, on the right, a simplified single collecting-duct cell.
A second hormone: aldosterone
When blood flow to the kidneys is low, the kidneys start a chain of signals called the renin–angiotensin–aldosterone system:
- The kidneys release an enzyme called renin.
- Renin starts a series of reactions that produces angiotensin II.
- Angiotensin II makes the adrenal cortex (the outer layer of the adrenal glands, which sit on the kidneys) release aldosterone.
- Aldosterone makes the later parts of the nephron reabsorb more sodium and remove more potassium into the urine. Water tends to follow the sodium back into the blood.
This helps restore blood volume. ADH and aldosterone are related but different: ADH acts directly on water, while aldosterone acts on salt, and water follows.

How do plants maintain water balance?
mechanisms in plants that allow water balance to be maintained (ACSBL115)
Plants need water for chemical reactions, for transporting substances and to keep their cells firm. A plant cell full of water presses outwards on its cell wall. This pressure is called turgor, and it holds soft parts of the plant upright.
Start here: the parts of a leaf
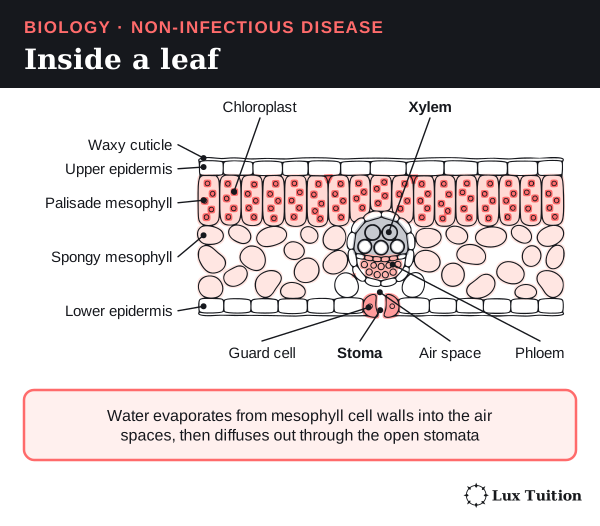
A leaf is built in layers (see the figure below):
- The waxy cuticle is a waterproof coating on the outside.
- The epidermis is a thin skin of cells on the top and bottom surfaces.
- Mesophyll cells fill the middle and carry out photosynthesis: using light energy to make sugar from carbon dioxide and water. Photosynthesis happens in chloroplasts, small green structures inside the cells. The upper palisade cells are packed with chloroplasts. The lower spongy cells are loosely packed, with air spaces between them.
- Veins contain xylem (tubes that carry water and minerals up from the roots) and phloem (tubes that carry sugars around the plant).
- Stomata (singular: stoma) are tiny pores, mostly on the lower surface. Each one sits between two guard cells, which open and close it.
How water moves through a plant
Transpiration is the loss of water vapour from a plant, mostly through its stomata. Leaves cannot avoid it: to take in carbon dioxide for photosynthesis, the stomata must open, and that exposes the moist inside of the leaf to the air.
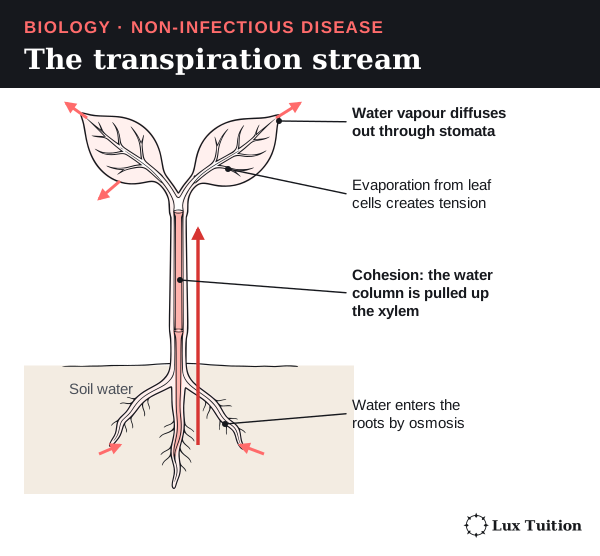
Water moves from where it is more available to where it is less available. Biologists describe this with water potential: water always moves from higher water potential to lower water potential. Follow the water from soil to air:
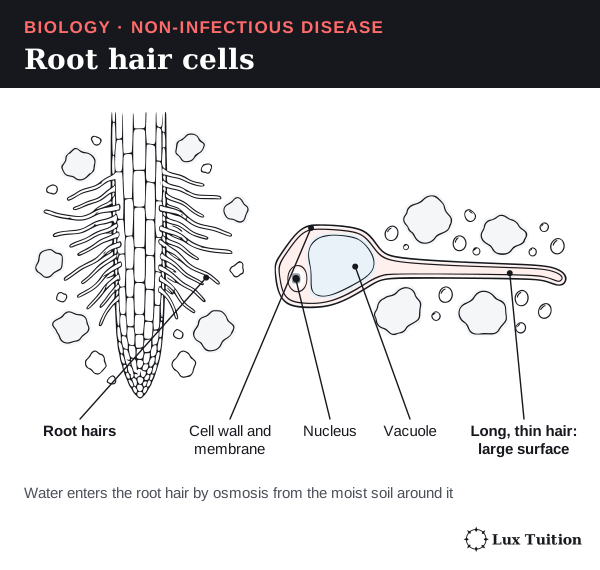
- Roots: water in moist soil has a higher water potential than the root cells, so it enters the roots by osmosis. Fine root hairs give a large surface for this.
- Leaves: water evaporates from the walls of mesophyll cells into the air spaces, then diffuses out through the stomata. This lowers the water potential in the leaf.
- Xylem: the loss of water at the top pulls on the column of water in the xylem. This pull is called tension.
- Cohesion: water molecules stick to each other (cohesion), so the pull is passed all the way down the column. Water also sticks to the xylem walls (adhesion), which helps.
- The whole column moves up together as a bulk flow. The xylem cells do not pump it.
Think of it like drinking through a straw: you pull at the top and the whole column of liquid rises. Unlike a straw, the pull comes from evaporation, not from muscles.
A root hair cell is a root surface cell with a long, thin extension that grows out between soil particles. Thousands of them give the root a huge surface for taking in water.
Guard cells open and close stomata
Guard cells control the size of the stomatal pore:
- Opening: guard cells take in solutes (such as potassium ions). Their water potential falls, so water enters by osmosis. They swell and become turgid. Their inner walls are thicker and less stretchy, so the cells curve apart and the pore opens.
- Closing: guard cells lose solutes, water follows by osmosis, turgor falls and the pore closes.
- When water is short: the plant hormone abscisic acid (ABA) signals guard cells to lose ions, so the stomata close.
Closing the stomata saves water, but it also cuts the supply of carbon dioxide, so photosynthesis can slow down. OpenStax: plant water transport.

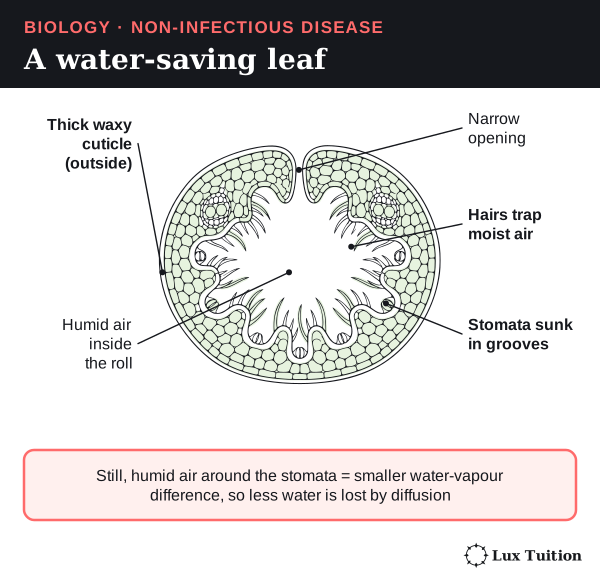
Leaf features that save water
| Feature | How it reduces water loss |
|---|---|
| Thick waxy cuticle | Makes it harder for water to evaporate through the leaf surface. It cuts water loss but does not make the leaf fully watertight. |
| Sunken stomata and leaf hairs | Trap a layer of still, moist air next to the pores. Less difference in water vapour means slower diffusion out. |
| Rolled leaves | Enclose humid air around the stomata. Some grasses roll up more tightly as certain cells lose turgor. |
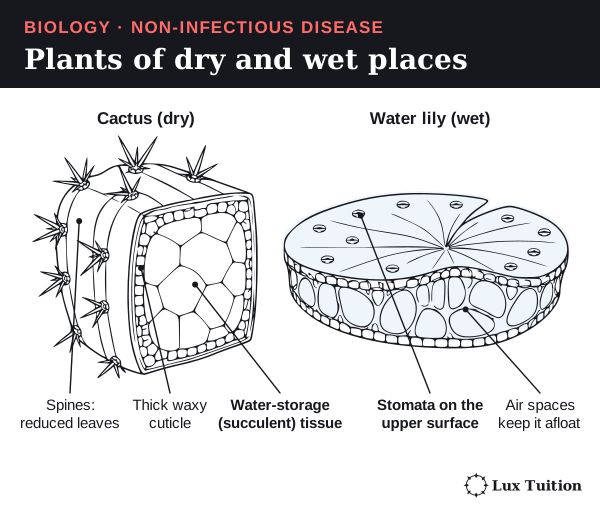
| Small leaves or spines | Less surface to lose water from. In cacti, the green stems do most of the photosynthesis instead. |
| Succulent (fleshy) tissues | Store water between rain events. |
| Extensive roots | Reach deep water, or spread wide to collect light rain quickly. |
| More upright leaves | Catch less of the strong midday sun, so the leaf heats less and loses less water. |
Plants of dry places are called xerophytes, and they usually combine several of these features. Plants of places with regular water are mesophytes. Water plants face different problems. Floating leaves have their stomata on the upper surface, which faces the air. Fully submerged leaves often have few or no working stomata because they take gases straight from the water. Not every species has every feature.
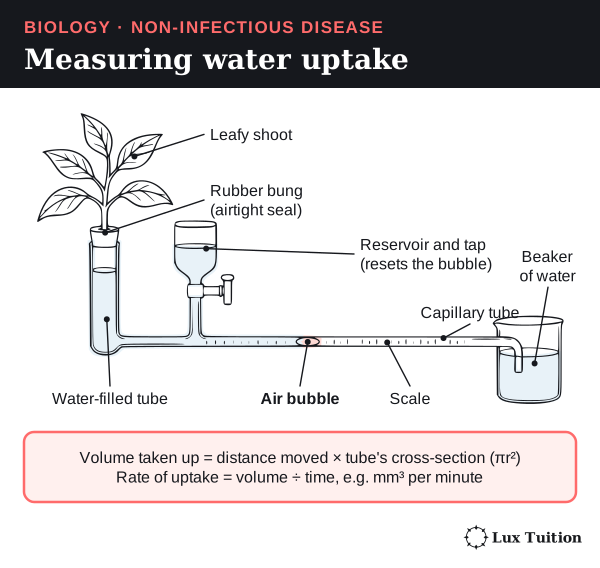
Measuring transpiration: the potometer
A potometer measures how fast a leafy shoot takes up water. As the shoot takes up water, an air bubble moves along a narrow tube with a scale.
- Distance moved ÷ time gives the bubble’s speed (for example, mm per minute). That is enough to compare shoots in the same potometer.
- The actual volume taken up is distance × the tube’s cross-sectional area (πr², where r is the internal radius).
- Rate of water uptake = volume ÷ time, for example in mm³ per minute.
A potometer measures water uptake, which is a good stand-in for water loss but not the same thing: a little of the water is used for growth or stored. A fair comparison controls leaf area, light, humidity, temperature and wind.
In an exam answer, use the chain feature → effect on water movement → benefit in these conditions, and state the trade-off with photosynthesis.
Do non-infectious diseases cause more deaths than infectious diseases?
What causes non-infectious diseases, and how do they affect the body?
genetic diseases
diseases caused by environmental exposure
nutritional diseases
A non-infectious disease is a disease that is not caught from another person, animal or germ (a pathogen). It can come from inherited genes, from something in the environment, from poor nutrition, from ageing, or from several of these acting together.
To show that a pathogen causes a disease, scientists use Koch’s postulates: find the microbe in every case, grow it in pure culture, show it causes the same disease in a healthy host, and recover the same microbe from that host (Module 7: Pasteur and Koch). Finding an infection more often in people with a disease is an association, not proof that the infection causes it.
Start here: genes, alleles and mutations
- An allele is one version of a gene. You inherit two copies of most genes, one from each parent.
- A mutation is a change in the DNA sequence.
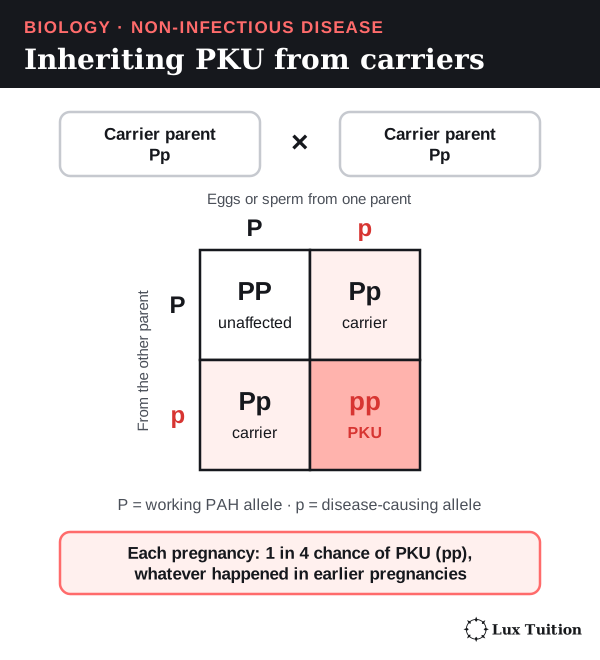
- An organism’s genotype is the alleles it has; its phenotype is its observable traits, including enzyme activity and disease risk. In PKU, the genotype pp gives the phenotype of low enzyme activity.
Three words are easy to mix up:
- Genetic means caused by changes in DNA. This does not always mean inherited. A mutation in a skin cell, for example, can lead to cancer without being in the person’s eggs or sperm, so it is not passed to children.
- Inherited means passed down from a parent.
- Congenital means present at birth, whatever the cause.
Gametes are the reproductive cells: eggs and sperm. When they join they form an embryo, the earliest stage of a developing baby. A change in a gamete or an early embryo can be inherited by future generations; a change in a somatic (body) cell cannot.
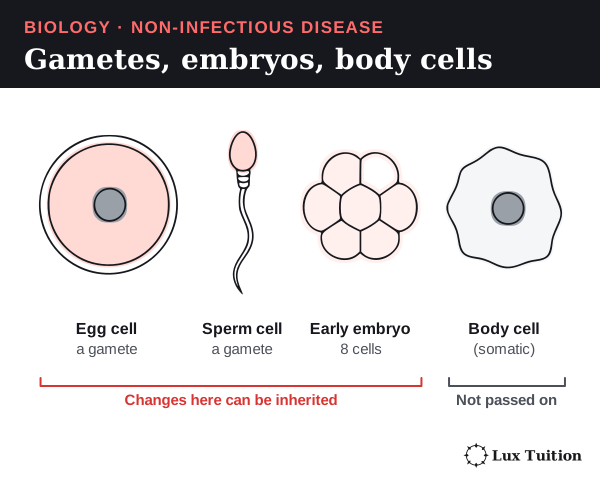
Risk factors
A risk factor is anything that makes a disease more likely, such as smoking or sun exposure. It does not mean that everyone exposed gets the disease. Age, family history, dose and duration of exposure, access to health care and other exposures all change the risk. A link to diet or behaviour does not mean there is only one cause, or that it is the sick person’s fault.
Examples of each type
| Category | Biological cause | Effect on cells, tissues or the body |
|---|---|---|
| Genetic: phenylketonuria (PKU) | Both copies of the PAH gene carry disease-causing variants. The enzyme phenylalanine hydroxylase works poorly, so the body cannot properly convert the amino acid phenylalanine into tyrosine. | Phenylalanine can build up to levels that damage the developing brain. Testing newborns and carefully controlling diet prevents much of this harm, even though the inherited variants remain. |
| Environmental: ultraviolet (UV) radiation | UV can damage the DNA in skin cells. Damage that is not repaired correctly can leave mutations. | Mutations in genes that control cell division can lead to skin cancers. Melanoma is a cancer of melanocytes, the skin cells that make the pigment melanin. UV exposure raises the risk; it does not guarantee melanoma. |
| Environmental: asbestos | Breathed-in asbestos fibres can stay in the lungs and the pleura (the thin membranes around the lungs) for years, causing inflammation and cell damage. | Raises the risk of diseases such as mesothelioma (a cancer of the pleura) and lung cancer, often decades later (a long latency). Looking only for symptoms soon after exposure cannot test this link. |
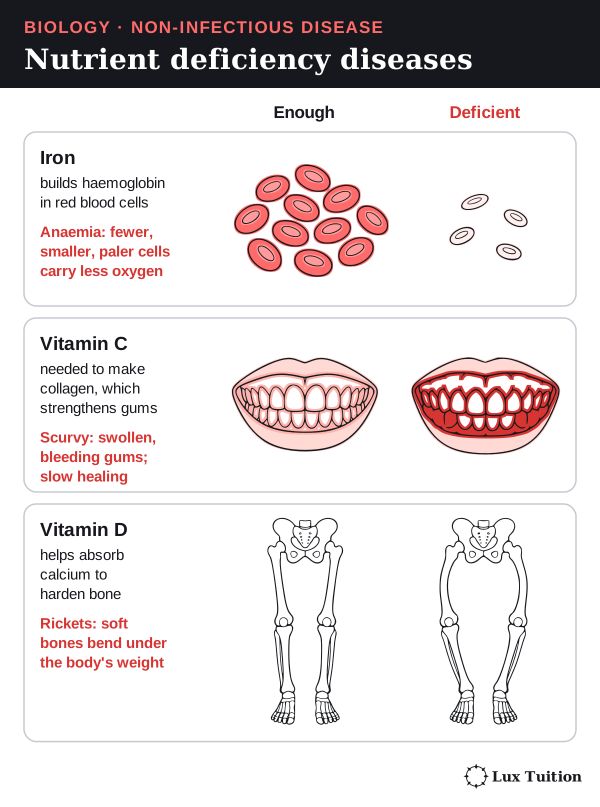
| Nutritional: iron deficiency | Too little usable iron limits the making of haemoglobin, the oxygen-carrying protein in red blood cells. Causes include low intake, poor absorption or blood loss. | Iron-deficiency anaemia: the blood carries less oxygen, causing tiredness, weakness and poor exercise tolerance. Not all anaemia is caused by iron deficiency. |
| Nutritional: vitamin C deficiency | Vitamin C is needed to make collagen, the protein fibre that strengthens connective tissue. | Scurvy: weak connective tissue, poor wound healing and bleeding gums. The chain runs from a nutrient’s job in the body to the tissue that fails. |
| Nutritional: vitamin D deficiency | Too little vitamin D reduces calcium absorption, so bones are not properly hardened (mineralised). | Rickets in children: soft bones that bend. The skin makes vitamin D in sunlight, so diet, absorption and sun exposure interact. More sun is not an unlimited fix, because of UV risk. |
| Multifactorial: type 2 diabetes | Insulin resistance plus not enough extra insulin from beta cells. Genes, age, activity, body fat and diet all contribute. | Long-term high blood glucose damages blood vessels and other tissues, raising the risk of kidney, eye, nerve and heart disease. It is not simply caused by eating sugar. |
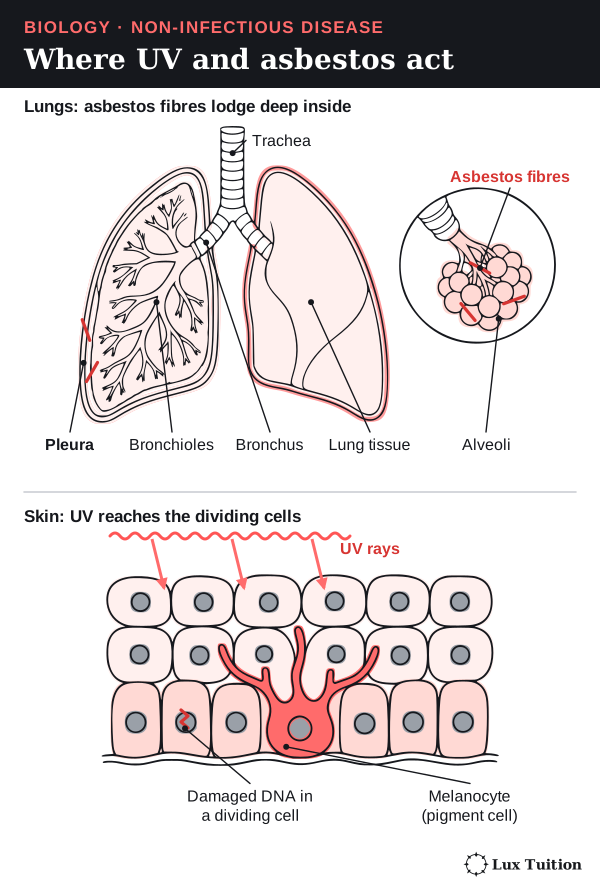
PKU in more detail
PKU is autosomal recessive (the gene is on a non-sex chromosome and two copies are needed): a person needs two disease-causing alleles to be affected. Two unaffected parents can each carry one. Each pregnancy then has a 1 in 4 chance of an affected child, no matter what happened in earlier pregnancies.
PKU shows how an inherited disease can have an outcome that the environment can change:
- Reduced PAH activity slows the conversion of phenylalanine to tyrosine, so phenylalanine builds up before the slowed step.
- Eating less phenylalanine means less builds up.
- Phenylalanine is still an essential amino acid (the body cannot make it), so the diet controls the amount carefully rather than removing it completely. MedlinePlus Genetics: PKU

Environmental disease: route and timing matter
How a person is exposed, and for how long, decides which tissue is harmed. Breathed-in asbestos fibres affect the lungs and the tissue around them; UV reaches exposed skin. A good explanation links four things: agent → tissue it reaches → change in the cells → disease. National Cancer Institute: asbestos and cancer
How does loss of cell-cycle control cause cancer?
cancer
Cancer is a group of diseases in which cells divide out of control and can spread into other tissues.
Start here: how normal tissues control division
Cells make more cells by dividing. The steps a cell goes through between one division and the next are called the cell cycle. Healthy tissues control it tightly:
- Signals tell a cell when to divide and when to stop.
- Checkpoints pause the cycle if the DNA is damaged or the cell is not ready.
- Damaged DNA is repaired.
- Badly damaged cells destroy themselves in a tidy, controlled way called apoptosis (programmed cell death).
How the controls fail
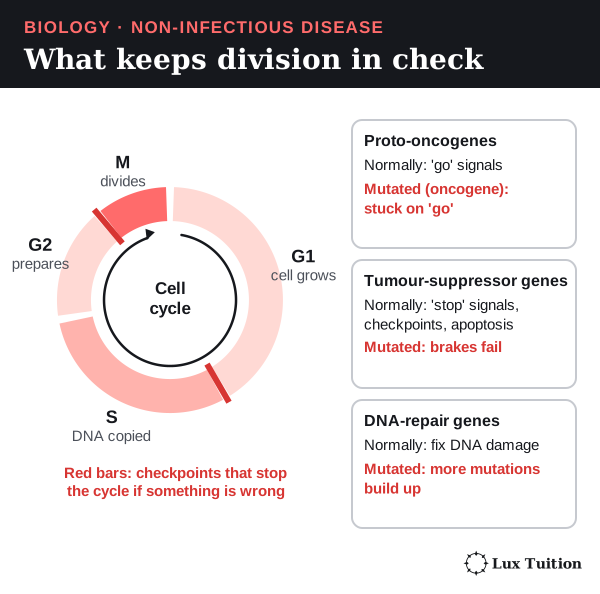
Three kinds of genes keep division in check. Mutations in them can let a line of cells escape control:
- Proto-oncogenes normally make “go” signals for division. A mutation can turn one into an oncogene that keeps sending “go” signals.
- Tumour-suppressor genes normally make “stop” signals, run checkpoints and trigger apoptosis. Losing tumour-suppressor activity removes a brake on division; many examples need both working copies to be lost.
- DNA-repair genes fix damage. If they fail, more mutations build up.
Think of it like a car: an oncogene is an accelerator stuck down, and a faulty tumour-suppressor gene is a brake that no longer works. The limit of the comparison: cancer usually needs several of these faults together, not just one.
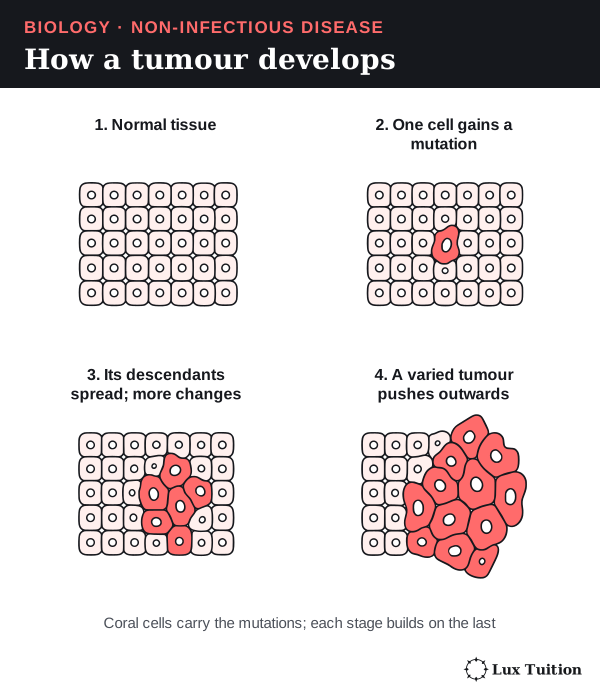
How a tumour grows and changes
- A cell gains a first mutation and divides. Its daughter cells inherit the mutation.
- One of those cells gains another mutation, and so on. Over time the group of cells becomes varied.
- Cells that divide faster, avoid apoptosis or survive treatment leave more descendants. This is selection inside the body.
This explains why cancer usually develops slowly over years, and why some cancers become resistant to treatment. No single mutation explains every cancer.
Linking a gene to the protein to cancer (a 4-mark 2022 HSC question used the EGFR gene in lung cancer). A mutation is a change in the DNA base sequence. If it is in a coding region, it can change the amino-acid sequence of the protein, which can change how the protein folds and so its function. If the altered protein is a growth-control receptor such as EGFR and it keeps stimulating division, cells may divide uncontrollably and form cancer.
Benign and malignant tumours
- A tumour is a lump of abnormally dividing cells.
- A benign tumour stays in one place and does not invade nearby tissue. It can still be dangerous if it presses on something important, such as the brain.
- A malignant tumour invades the tissue around it.
- Metastasis is when cancer cells travel in the blood or lymph (a clear fluid that drains tissue fluid) to another part of the body and start growing there (a secondary tumour).
Some cancers, such as leukaemias (cancers of blood-forming cells), do not form a solid tumour. A secondary tumour is still the original cancer type: melanoma that spreads to the lung is still melanoma.
Why cancer harms the body, and what causes it
Cancer can stop organs working, use up the body’s resources, and invade structures that homeostasis depends on. Causes include environmental carcinogens (cancer-causing agents such as UV and asbestos), inherited risk, and copying errors made when DNA is replicated.
Some long-lasting infections also raise cancer risk. Certain types of human papillomavirus (HPV) can start the cell changes that lead to cancer of the cervix (the neck of the uterus, shown in the childbirth figure earlier). The virus can be passed between people, but the cancer itself is classified here as non-infectious. National Cancer Institute: what is cancer?

How do incidence, prevalence and mortality measure disease burden?
nutritional diseases
diseases caused by environmental exposure
Epidemiology is the study of how diseases are spread across populations, and which factors affect that spread. A population here means a defined group of people, such as everyone living in NSW in 2021.
The three key measures
- Incidence counts new cases that appear during a period of time.
- Prevalence counts all existing cases (new and old) at one point in time.
- Mortality counts deaths from the disease.
Each is usually given as a rate: a number divided by the size of the population, so that groups of different sizes can be compared.
| Measure | How it is calculated | What it tells you |
|---|---|---|
| Incidence proportion | New cases during a period ÷ people who were disease-free (at risk) at the start | The chance of becoming a case over that period, subject to the study’s follow-up conditions |
| Incidence rate | New cases ÷ total person-time at risk (person-years: one person followed for one year counts as one person-year) | How fast new cases appear when people were followed for different lengths of time |
| Point prevalence | Existing cases at one time ÷ whole population at that time | How many people are living with the disease, and the demand for ongoing care |
| Mortality rate | Deaths from the disease during a period ÷ population (or person-time) | The burden of deaths in the population; the rule for deciding the cause of death must be stated |
| Case fatality | Deaths among diagnosed cases ÷ diagnosed cases, over a stated period | How severe the disease is among people who have it. It is not the same as population mortality |
A worked example
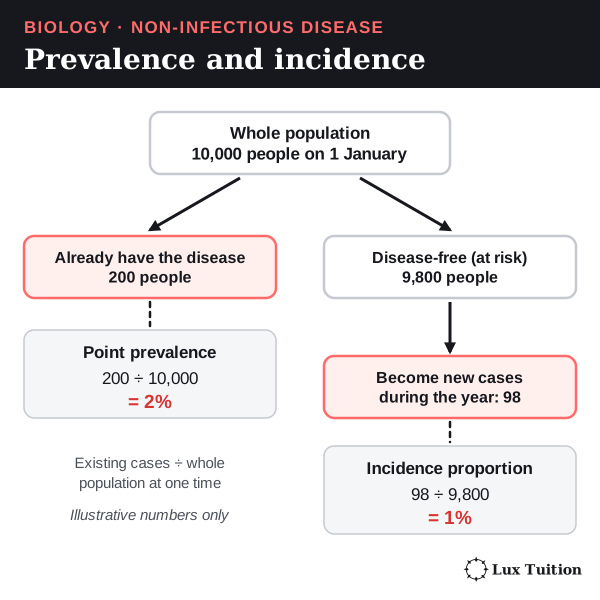
Imagine a closed population of 10,000 people (no one moves in or out). On 1 January, 200 already have a disease. During the year, 98 of the other 9,800 people develop it.
- Point prevalence on 1 January = 200 ÷ 10,000 = 2%.
- One-year incidence proportion = 98 ÷ 9,800 = 1%. Only the 9,800 disease-free people could become new cases, so they are the bottom number.
- You cannot work out the prevalence at the end of the year from these numbers alone. You would also need to know who died, recovered or moved.
These are made-up numbers to show the method, not Australian statistics.
How incidence and prevalence are linked
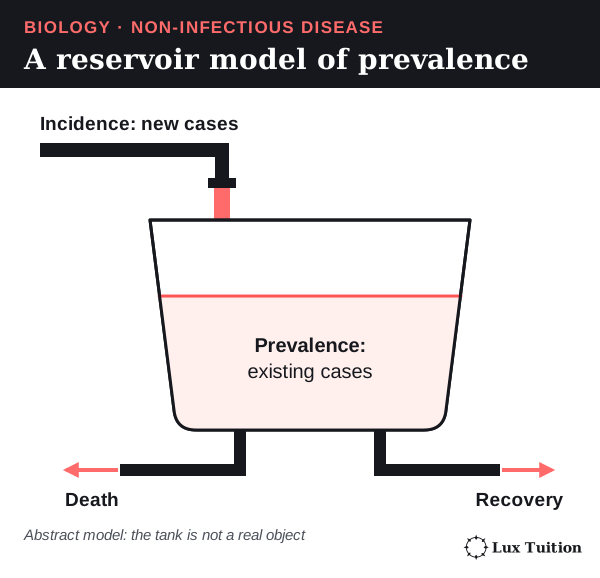
Prevalence can rise even while incidence falls, if people with the disease live longer. A very deadly disease can have low prevalence because people with it die quickly. Under special steady conditions, prevalence ≈ incidence rate × average length of the disease. This is a useful model, not a formula to apply to every changing population.
Counts, rates and age
- A count (such as 1.2 million people) shows the total load on health services.
- A rate lets you compare populations of different sizes fairly.
- An age-specific rate compares people in the same age group.
- An age-standardised rate adjusts for the fact that some populations are older than others. It applies each group’s age-specific rates to the same standard population. It is a number for comparison, not the actual risk for an average person.
Comparisons are only fair if they use the same case definitions, time periods and standard population.
Do non-infectious diseases cause more deaths than infectious diseases?
The answer depends on the population, year and classification. The World Health Organization (WHO) estimates that noncommunicable (non-infectious) diseases caused at least 43 million deaths worldwide in 2021: 75% of deaths, not counting pandemic-related deaths. Among people under 70, they caused more deaths than all other causes combined.
This supports the claim for that defined global comparison. It is not true for every country, age group or outbreak year. Also, the other 25% are not all “infectious”: injuries are a separate category. WHO noncommunicable-disease factsheet, 25 September 2025
Why are epidemiological studies used?
What do Australian data show about nutritional and environmental disease?
nutritional diseases
diseases caused by environmental exposure
Real data show what the measures from the last section look like in practice. Two examples are used here: type 2 diabetes, a disease with many causes, including nutrition; and melanoma, a skin cancer linked to an environmental exposure (UV). The years differ because national datasets are published at different times.
Read each row’s definition before you use its number. A count, a percentage and an age-standardised rate are different kinds of measure.
| Disease and measure | Observation | Definition and limitation |
|---|---|---|
| Type 2 diabetes prevalence, 2021 | About 1.2 million people, or 4.6% of Australians | Diagnosed cases identified through the NDSS and APEG datasets; undiagnosed disease is not fully captured. |
| Type 2 diabetes incidence, 2021 | About 45,700 newly diagnosed cases; highest rates at ages 65–69: 515 per 100,000 males and 383 per 100,000 females (age-specific) | New diagnoses recorded in the data, not proof that biological onset occurred in that year. A count is not a rate: divide by the population at risk over the same period to compare groups. |
| Diabetes mortality, 2024 | 56.0 deaths per 100,000, age-standardised | Diabetes as an underlying and/or associated cause; all diabetes types, not a type 2-specific mortality estimate. The 2024 death data are preliminary. |
| Type 2 diabetes mortality, 2024, approximate calculation | About 48 deaths per 100,000, crude | AIHW attributes 63% of diabetes-related deaths to type 2. Multiplying that rounded proportion by the all-diabetes crude rate, 76.7 per 100,000, gives approximately 48.3. This is a derived approximation, not a published type 2 age-standardised rate; preliminary data and unspecified diabetes types limit interpretation. |
| Melanoma incidence, 2021 | 15,034 new cases; age-standardised rate 60 per 100,000 | Observed diagnoses. This is distinct from the source’s later projected incidence. |
| Melanoma five-year prevalence, end of 2021 | 69,131 people | People alive who had been diagnosed during 2017–2021. This limited-duration measure is not all people ever diagnosed, nor a count of all active tumours. |
| Melanoma mortality, 2023 | 1,527 deaths; age-standardised rate 5.9 per 100,000 | Observed deaths; a different reference year from the incidence and prevalence rows. |
Sources: AIHW type 2 diabetes, AIHW diabetes deaths, and Cancer Australia melanoma statistics, accessed 14 October 2026. Do not plot these rows together on one axis: counts, percentages and age-standardised rates mean different things.
Patterns in type 2 diabetes
- Age: prevalence is higher in older age groups.
- Sex: the age-standardised prevalence is higher in males than in females.
- Disadvantage: prevalence in the most socioeconomically disadvantaged areas is about twice that in the least disadvantaged areas.
These patterns show where services are needed and which questions to research. They do not prove that sex or postcode on its own causes diabetes. Age, money, access to healthy food, chances to be active, health care and how often people get tested all interact.
Rising counts, steady rates
- The number of people living with diagnosed type 2 diabetes has risen a lot.
- Over the most recent decade, though, the age-standardised prevalence stayed fairly steady.
- So the rise in the count can be explained by population growth, an older population and people surviving longer. It does not need an equal rise in each person’s risk.
Registration data are useful but incomplete: undiagnosed cases and differences in registration can change the patterns.
The same AIHW series shows a fall of roughly 45% in age-standardised type 2 diabetes incidence between 2000 and 2021. This does not contradict the rising number of people living with it:
- Incidence measures people entering the diagnosed group.
- Prevalence also depends on how long they survive and on population change.
- Changes in how diabetes is diagnosed or registered may also affect the fall, so the graph alone cannot tell you why it happened.
Melanoma: incidence and prevalence tell different stories
The AIHW figures below are rates age-standardised to the 2025 Australian population. They are observed values, not projections.
| Measure, persons of all ages | Earlier observation | Later observation |
|---|---|---|
| Annual melanoma incidence | 65 new cases per 100,000, 2019 | 60 new cases per 100,000, 2021 |
| Five-year melanoma prevalence, people alive at year-end | 37,576 people; 228.0 per 100,000, 2000, diagnosed during 1996–2000 | 69,131 people; 271.4 per 100,000, 2021, diagnosed during 2017–2021 |
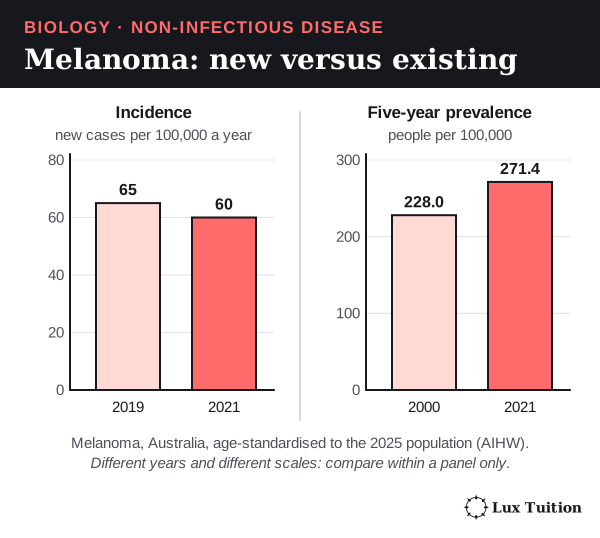
Incidence: fewer new diagnoses were recorded per standardised population in 2021. Disrupted skin checks during the pandemic are one plausible contributor. This short gap does not show that the underlying UV-related risk fell. AIHW labels its 2022–2025 incidence values as projections, so those are left out here. AIHW melanoma commentary, Figure 1 and “Uncertainties in projected melanoma incidence rates”
Five-year prevalence: between 2000 and 2021, the count rose by about 84%, but the age-standardised rate rose by only about 19% (calculated from the values in the table). So more people were alive within five years of a diagnosis, and population size and ageing do not explain all of the rise. Incidence history, survival and detection all affect this measure, and these data cannot separate their effects.
Two cautions:
- The 2000 and 2021 windows contain different people. This is not one group followed over time.
- Five-year prevalence leaves out people diagnosed earlier than the window, and it does not mean every person counted still has an active tumour. AIHW prevalence dashboard: melanoma, five-year duration, persons, all ages, years 2000 and 2021
For how to choose, draw and extrapolate graphs of data like these, see Representing data in the Working Scientifically section.
How is type 2 diabetes managed, and what research could improve treatment?
Treatment for type 2 diabetes has two aims: to bring blood glucose regulation closer to normal, and to prevent or reduce complications (extra problems the disease causes over time, such as kidney or eye damage).
Lifestyle changes
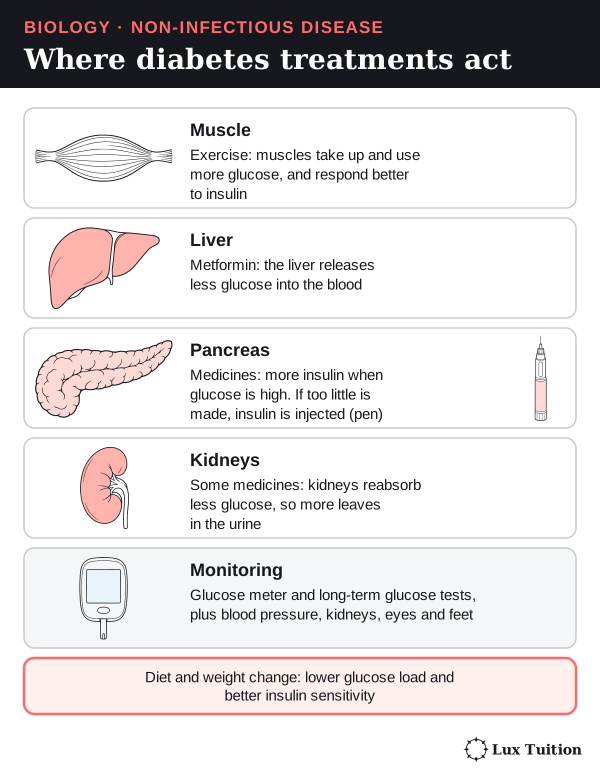
- Physical activity makes muscles use more glucose and can make cells more sensitive to insulin.
- Diet and weight changes, where appropriate, can lower the glucose load and improve regulation.
How well these work depends on a person’s genes and on how much beta-cell function they have left. They are not a guaranteed replacement for medicine.
Medicines act at different points in the control system
- Metformin makes the liver release less glucose and improves glucose regulation.
- Some medicines increase insulin release, but only when glucose is high.
- Some medicines make the kidneys reabsorb less glucose, so more leaves in the urine.
- Insulin can be given when the body no longer makes enough of its own.
The choice depends on the person, including whether they also have heart or kidney disease. Knowing the biology does not mean there is one prescription that suits everyone.
Managing more than one number
Care goes beyond a single glucose reading. Doctors monitor long-term glucose control, blood pressure, kidney function, the retina (the light-sensing layer at the back of the eye) and the feet, to catch complications early. Diabetes damages blood vessels and nerves, so care involves a team of health workers.
Treatment can improve glucose control without undoing damage that has already happened. Some people reach remission (normal glucose without diabetes medicine), but this is not a permanent cure, and they still need check-ups. NIDDK: type 2 diabetes
Future directions for research
Researchers are investigating:
- why beta-cell function declines over time;
- how to make remission last;
- which treatments best prevent heart and kidney complications;
- how to deliver prevention fairly to everyone who needs it.
A new treatment should be judged on lasting health outcomes, side effects, cost and access, not just on a short-term fall in blood glucose. A treatment that works in a controlled trial may help less in real life if people cannot get it or keep using it. NIDDK diabetes treatment, prevention and complications research
How do epidemiological study methods affect the strength of evidence?
Different study designs answer different questions. How strong the evidence is depends on how the study chose its participants, measured exposures and outcomes, and set up comparison groups.
Two words first:
- An exposure is the thing being studied as a possible cause, such as smoking, air pollution or a diet.
- An outcome is the result being measured, usually whether people develop the disease.
The main study designs
| Design | How it works | Main strength | Important limitation |
|---|---|---|---|
| Cross-sectional study | Measures exposure and disease in a sample at one point in time (“a snapshot”) | Estimates prevalence and finds links quickly | Usually cannot show whether the exposure came before the disease |
| Cohort study | Follows people over time and compares outcomes across different exposure levels, using a low-exposure or unexposed comparison group | Can measure incidence and shows what came first | Diseases with a long delay need very long follow-up; drop-outs (attrition) and confounding (another factor linked to both exposure and disease creating a false link) can distort results |
| Case-control study | Starts with people who have the disease (cases) and people who do not (controls), then looks back at past exposures | Efficient for rare diseases or long delays | People may misremember (recall bias), controls may be badly chosen (control-selection bias), and it cannot measure incidence directly |
| Randomised controlled trial (RCT) | Randomly assigns people to a treatment or a comparison group, then compares outcomes | Random assignment balances other factors between groups, on average | Cost, people not sticking to the plan, ethics, and narrow entry rules can limit what it shows |
| Ecological study | Compares whole populations, such as cities or countries | Useful for broad patterns and policy questions | A pattern across groups may not hold for individuals (the ecological fallacy) |

Evaluating a study: an air pollution example
Suppose a study compares cancer in two cities using a short survey of symptoms. Its problems:
- Exposure is not measured well. People in the same city breathe different amounts of pollution, depending on their job, home and time outdoors.
- The follow-up is too short. Cancer can appear decades after exposure, so 12 months can miss it.
- Confounders are ignored. A confounder is another factor linked to both the exposure and the disease, which can create a false link. Here: smoking, age, workplace exposures and access to diagnosis.
- A big sample does not fix these. It makes the estimate more precise but does not remove systematic errors.
A stronger cohort design would:
- recruit a defined group of people who do not have the disease;
- measure each person’s exposure in the same way, and repeat it if they move or conditions change (repeated measurements reduce misclassification, which is putting people in the wrong exposure group);
- record the main confounders;
- follow everyone for a biologically sensible length of time;
- compare results within groups (stratify) by age at exposure and by region, because risk differs between these groups and they can otherwise be confounded;
- confirm diagnoses using the same criteria for everyone.
Adjustment can reduce measured confounding; residual and unmeasured confounding may remain. And it would be unethical to expose people to a known harmful substance just to see whether it causes cancer, which is why such questions use observational studies.
Bias, chance and cause
- Bias is a systematic error that pushes results one way, such as healthier people being more likely to stay in a study.
- Random variation (chance) creates uncertainty even in a well-designed study.
- A confidence interval shows how precise an estimate is. It expresses precision under the statistical model and its assumptions, and a narrow interval does not exclude bias.
- A result can be statistically significant (a difference this large would be unlikely if there were no real effect, given the test’s assumptions) but still too small to matter for health. Statistical significance is not the same as effect size (how big the difference is) or medical importance.
A link is more likely to be causal when: different methods give consistent results, there is a believable biological mechanism, the exposure comes before the disease, and more exposure leads to more disease (a dose–response relationship). No single one proves it. Also check that the outcome measured is the one claimed: data on dementia in general are not data on Alzheimer’s disease.
Relative and absolute risk
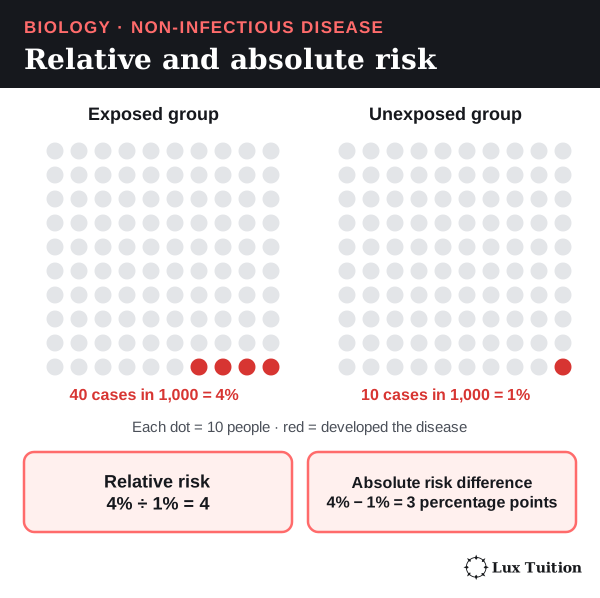
Suppose 40 of 1,000 exposed people and 10 of 1,000 similar unexposed people develop a disease. Their risks are 4% and 1%.
- Relative risk = 4% ÷ 1% = 4 (“four times the risk”).
- Absolute risk difference = 4% − 1% = 3 percentage points (the extra cases in that population).
Both matter. “Four times the risk” sounds dramatic, but the absolute difference tells you how many extra people are actually affected. These are made-up numbers to show the calculation, not evidence about a real exposure.
What does the Diabetes Prevention Program show about the benefits of epidemiological studies?
The Diabetes Prevention Program (DPP) was a large study in the United States. It tested whether type 2 diabetes could be delayed or prevented in adults at high risk.
How the study was set up
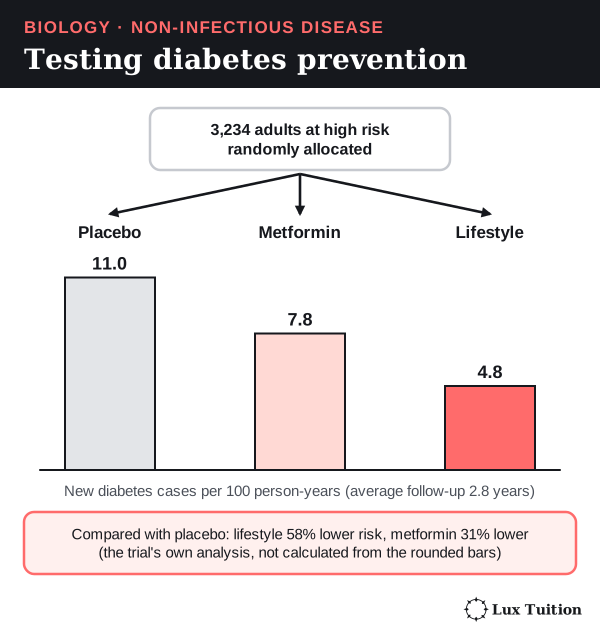
- 3,234 participants were randomly allocated to one of three groups: a placebo (a dummy pill with no active drug), metformin, or an intensive lifestyle programme (diet, physical activity and weight loss support).
- They were followed for an average of 2.8 years.
- The outcome was whether they developed diabetes, diagnosed with standard criteria. It was not just whether they reported knowing more about healthy living.
What it found
New diabetes cases were 11.0, 7.8 and 4.8 per 100 person-years in the placebo, metformin and lifestyle groups. (A person-year is one person followed for one year.) The published analysis estimated a 58% lower risk with lifestyle change and 31% lower with metformin, compared with placebo.
The 58% figure comes from the trial’s own analysis. You cannot rebuild it exactly from the rounded rates. It also does not mean that 58% of every population would avoid diabetes. Knowler and colleagues, original 2002 trial
Strengths
- Random allocation made the groups similar at the start, so the difference in outcome is more likely to be caused by the interventions.
- Standard diagnostic criteria made the outcome comparisons fair.
Limitations
- Participants and staff knew who was in the lifestyle programme (it could not be hidden).
- Volunteers were chosen because they were at high risk, so results may not apply to everyone.
- An intensive trial programme may be hard to run for a whole population.
- The lifestyle programme combined several parts, so it cannot show the effect of one food, one type of exercise or one counselling session.
- A few years of follow-up cannot prove lifelong prevention.
Why epidemiological studies are worth doing
The DPP moved from “this is linked to diabetes” to “this approach prevents it”. More generally, epidemiology can:
- identify high-risk groups;
- estimate how many services will be needed;
- test whether an intervention actually changes disease outcomes.
Cancer registries, for example, show where diagnosis and treatment services are needed. These benefits depend on data that are representative and consistent. A biased sample can steer resources away from people whose disease is poorly recorded.
How can non-infectious diseases be prevented?
How effective are education campaigns in preventing non-infectious disease?
educational programs and campaigns
Three levels of prevention
- Primary prevention stops a disease from developing in the first place. Example: sun protection to prevent skin cancer.
- Secondary prevention finds a disease, or the early changes that lead to it, early enough to improve the outcome. Example: skin checks or screening.
- Tertiary prevention limits complications in people who already have the disease. Example: foot and eye checks in diabetes.
Keep these apart when you judge a programme. More diagnoses after a screening programme can mean better detection, not failed prevention.
Education campaigns: knowing is not doing
Education can explain a risk and what to do about it, but knowing does not guarantee that people act. A sun-protection campaign is more convincing when its message is backed up by shade, suitable clothing, available sunscreen and timetables that cut time in the sun.
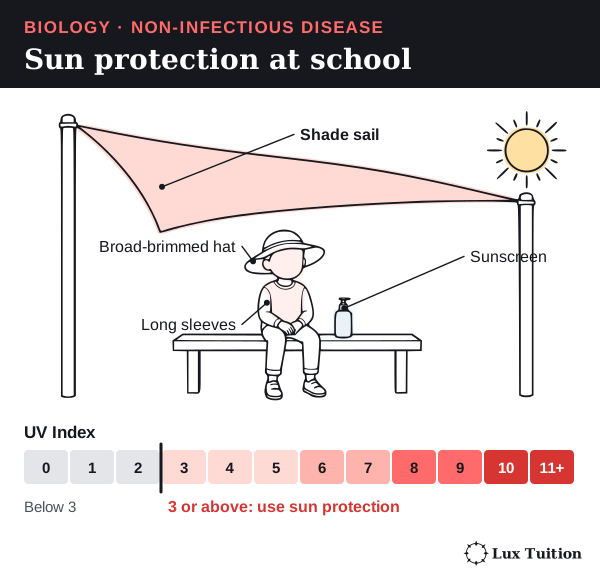
UV can damage skin even on cool or cloudy days, so the UV Index (a measure of the strength of the sun’s UV radiation) is more useful than temperature or a fixed “safe” time of day. Australian guidance recommends sun protection whenever the UV Index is 3 or above, with extra care for long periods outdoors. ARPANSA: sun exposure
Designing a prevention strategy
A strategy that can be evaluated needs three things: a defined population, a biological target and outcomes you can measure. Take a school sun-protection strategy:
- What it does: clear UV information, shaded lunch areas, sunscreen that is easy to get, and consistent hat and clothing rules.
- Early outcomes: whether students actually protect themselves, and how much time they spend in strong sun.
- Nearer health outcome: sunburn.
- Long-term outcome: skin-cancer incidence, which takes many years of follow-up.
- Fairness check: monitoring which students take part shows whether it reaches everyone, not only those who already own hats and sunscreen.
Evidence from SunSmart
Repeated surveys linked to Melbourne’s SunSmart programme tracked behaviour from 1987 to 2017. They found more sun protection and less sunburn over that time. This supports the programme’s practical value, but the surveys were observational, so not every change can be credited to the campaign. Limitations:
- people reported their own behaviour (self-report);
- the people surveyed changed over time;
- other social and policy changes happened at the same time.
A balanced judgement combines measured behaviour, a believable biological mechanism and longer-term disease trends, while stating these limits. Original SunSmart evaluation
Other prevention strategies
- Nutrition education works better when healthy food is affordable and available.
- Tobacco prevention combines messages with measures that cut exposure and help people quit.
- Genetic counselling and screening can inform decisions about having children or managing a condition, but screening does not change anyone’s DNA.
Judge a strategy by its reach, whether behaviour changes and lasts, its effect on disease, unwanted side effects, cost and fairness. Counting advertisements or website visits is not proof of prevention.
How can genetic engineering help prevent or treat disease?
genetic engineering
Genetic engineering means deliberately changing an organism’s genetic material, or using an engineered organism to make a useful product. In disease, it can:
- prevent the process that leads to a disease;
- supply a function the body is missing;
- reduce complications.
None of these is the same as removing a disease-causing allele from a whole population.
Example 1: the recombinant HPV vaccine (prevention)
The HPV vaccine links genetic technology to cancer prevention. Recombinant means made by combining DNA from different sources.
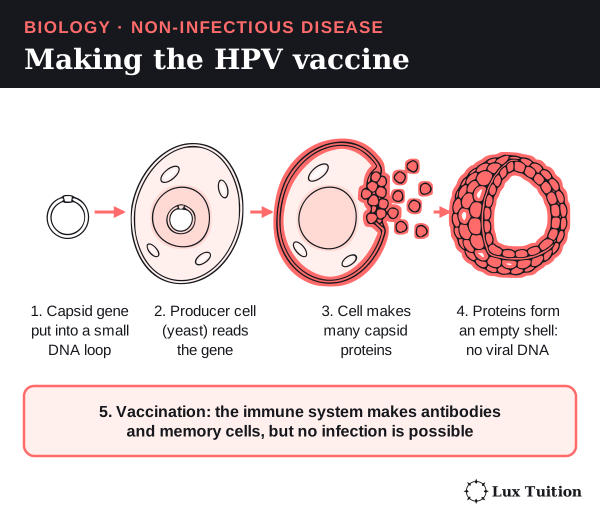
- The gene for the HPV capsid protein (the protein of the virus’s outer shell) is put into producer cells, such as yeast.
- The cells make large amounts of capsid protein.
- The proteins assemble by themselves into virus-like particles. These look like the outside of the virus but contain no viral genome (the virus’s full set of genetic material), so they cannot cause infection. Only the producer cells are engineered; vaccination does not edit the recipient’s DNA.
- Vaccination with these particles makes the immune system produce antibodies (proteins that stick to one particular invader and help destroy it) and memory cells (long-lived white blood cells that respond faster if the real virus arrives). This lowers the risk of infection by the HPV types in the vaccine, and so lowers the later risk of the cancers they cause.
The vaccine does not treat a cancer that already exists, and it does not replace other prevention such as screening. National Cancer Institute: HPV vaccines
Example 2: somatic gene therapy (treatment)
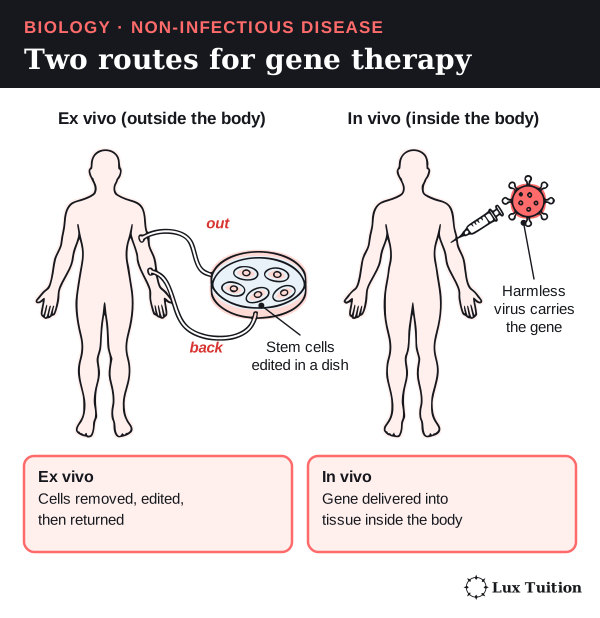
Somatic cells are body cells, not eggs or sperm. Somatic gene therapy changes cells in the treated person only. It can deliver a working gene, change how a gene is expressed, or edit a DNA sequence. There are two routes:
- Ex vivo (“outside the living body”): cells are removed, changed in the laboratory and returned.
- In vivo (“inside the living body”): the genetic material is delivered to the target tissue inside the body, often carried by a harmless virus called a vector.
The treatment must reach enough of the right cells and give a useful, controlled effect. Possible problems include immune reactions, unintended genetic changes, missing some target tissue, effects that fade, a heavy treatment burden and high cost.
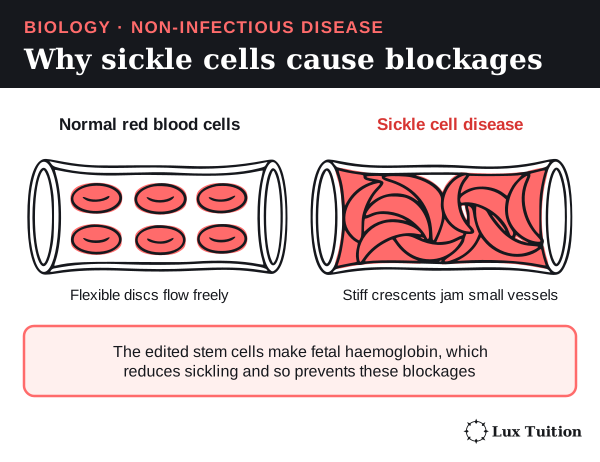
Sickle cell disease is an inherited disease in which a faulty form of haemoglobin makes red blood cells stiff and crescent-shaped. These sickled cells block small blood vessels and cause pain and organ damage. In December 2023 the US Food and Drug Administration (FDA) approved a treatment based on CRISPR, a gene-editing tool that cuts DNA at a chosen sequence so it can be changed:
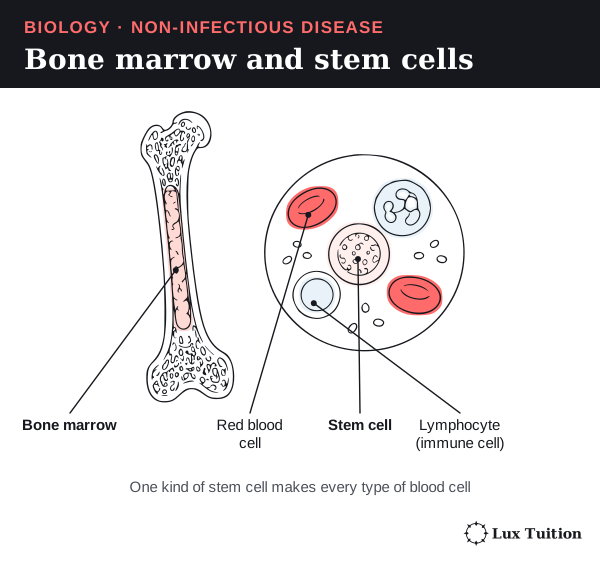
- The patient’s own blood stem cells are collected. These are unspecialised cells in the bone marrow (the soft tissue inside bones) that divide to make every type of blood cell.
This can prevent painful blockages in the treated person. But it is not population screening, it does not edit the person’s eggs or sperm, and it does not stop the faulty allele being passed to their children. Conditioning and specialist care are major limitations. FDA’s 2023 gene-therapy announcement
Two important distinctions
- Engineered human insulin: microbes are engineered to make a therapeutic protein. Giving that insulin does not change the patient’s genes or remove the cause of their diabetes.
- Engineered immune cells (white blood cells such as lymphocytes, made in the bone marrow) can help the body recognise certain cancers, but they are not a universal cancer cure.
Effectiveness must be judged for each disease, mechanism and population, keeping real clinical results separate from laboratory promise.
Evaluating genetic engineering
Evaluation also covers:
- Informed consent and follow-up: patients must understand the risks, and long-term effects must be tracked.
- Fair access: a treatment that works technically may reach few people if it needs specialist hospitals or costs too much.
- Who is affected: somatic treatment affects only the treated person. Changing gametes (eggs and sperm) or embryos (the earliest stage of a developing baby) raises extra ethical questions, because, if the change is in cells that pass to children, descendants could inherit changes they never agreed to.
Testing embryos for a variant is genetic testing, not automatically genetic engineering: finding a DNA sequence and editing it are different operations.
How can technologies be used to assist people who experience disorders?
How do ear structures explain the causes of hearing loss?
hearing loss
Start here: what sound is
Sound is a pattern of pressure waves (vibrations) travelling through air, water or solids. Two properties matter:
- Frequency is how many vibrations happen each second. It mostly decides the pitch (how high or low a sound is).
- Amplitude is the size of the pressure change. It relates to how loud the sound is (its intensity).
The ear’s job is to turn these vibrations into nerve signals the brain can interpret. Turning one form of energy or signal into another is called transduction.
The parts of the ear
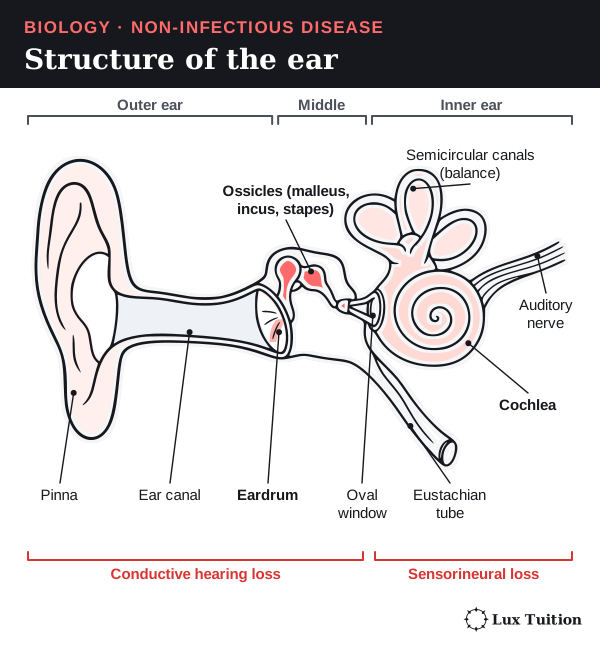
The ear has three regions: the outer ear collects sound, the middle ear passes vibrations on, and the inner ear turns them into nerve signals.
| Structure | Job in hearing |
|---|---|
| Pinna and ear canal | Collect sound and channel it to the eardrum. |
| Tympanic membrane (eardrum) | Vibrates when sound pressure changes reach it. |
| Malleus, incus and stapes (the ossicles) | Pass the vibration across the middle ear. Their lever action, and the much smaller area of the oval window, increase the pressure as sound enters the fluid-filled inner ear. They do not create extra energy. |
| Oval and round windows | The stapes pushes the oval window, making pressure waves in the cochlear fluid. The flexible round window bulges out to let the fluid move. |
| Cochlea and basilar membrane | The cochlea is a coiled, fluid-filled tube. The basilar membrane inside it changes in stiffness along its length, so high frequencies vibrate it most near the base and low frequencies near the apex (tip). |
| Hair cells of the organ of Corti | Hair cells are the sensory receptor cells. When their tiny hair-like stereocilia bend, ion channels open, the cell’s voltage changes and it releases more or less neurotransmitter onto sensory neurons. |
| Auditory nerve and brain | Neurons carry action potentials to the brain, where sound is interpreted. Hair cells are receptor cells, separate from the neurons that carry the action potentials. |
The Eustachian tube connects the middle ear to the throat and balances air pressure on both sides of the eardrum. The semicircular canals help with balance, not hearing. OpenStax: hearing
Two main types of hearing loss
Conductive hearing loss: vibrations are not passed properly through the outer or middle ear. The cochlea may still work. Causes:
- impacted earwax blocking the canal;
- a perforated (torn) eardrum that vibrates poorly;
- fluid in the middle ear that stops the ossicles moving freely;
- otosclerosis, abnormal bone growth that stiffens the ossicles.
Sensorineural hearing loss: damage to the cochlea (usually its hair cells) or to the auditory nerve pathway. Causes:
- loud noise damaging hair cells, so they can no longer transduce vibration;
- ageing;
- inherited gene variants;
- some medicines that damage the ear (ototoxic medicines).
Turning up the volume cannot restore hair cells that no longer work. Mixed hearing loss has both conductive and sensorineural parts. An infection can leave lasting structural damage even after the infection itself has cleared. NIDCD: noise-induced hearing loss

How do eye structures explain visual disorders?
visual disorders
Start here: how the eye forms an image
To see clearly, the eye must bend (refract) incoming light so it comes to a sharp point, or focus, exactly on the retina, the light-sensitive layer at the back of the eye.
Follow light into the eye:
- The clear cornea at the front does most of the bending.
- Light passes through the aqueous humour (watery fluid) and the pupil. The pupil is just a hole, not a lens.
- The coloured iris changes the size of the pupil to control how much light gets in.
- The lens fine-tunes the focus.
- Light crosses the jelly-like vitreous humour and reaches the retina.
The tough white sclera protects the eye. The choroid has blood vessels that supply the eye and dark pigment that absorbs stray light.
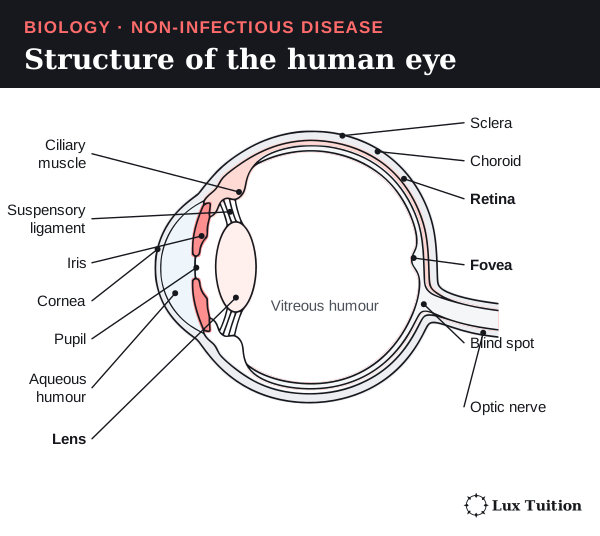
Accommodation: focusing near and far
Accommodation is the lens changing shape to focus on objects at different distances. The lens hangs from the ciliary muscle by the suspensory ligaments.
- Near object: the ciliary muscle contracts, the ligaments go slack, and the elastic lens becomes rounder. A rounder lens bends light more strongly.
- Distant object: the ciliary muscle relaxes, the ligaments pull tight, and the lens is stretched flatter. It bends light less.
The eye changes the lens. It does not move the retina towards the focus.

The retina: rods and cones
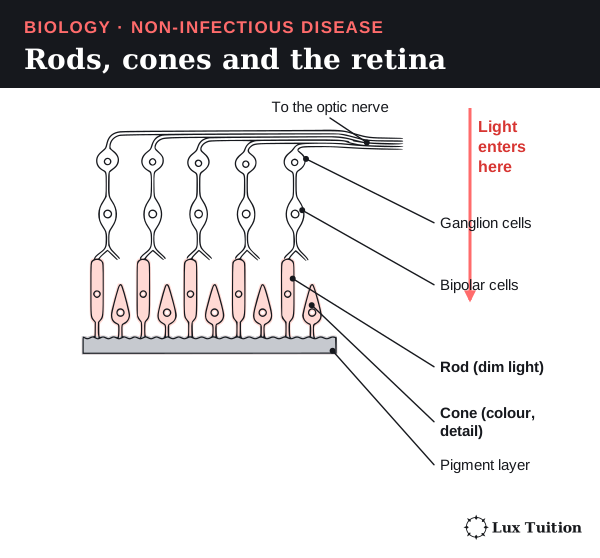
The retina contains two kinds of photoreceptor (light-sensing cell):
- Rods are very sensitive, so they work in dim light, but they cannot tell colours apart.
- Cones need brighter light. There are different types, each most sensitive to different (overlapping) wavelengths, which gives colour vision. Cones are packed tightly in the fovea, a small dip in the retina that gives the sharpest detail.
From light to brain:
- Light changes the activity of the photoreceptors.
- They pass signals to a network of neurons in the retina: bipolar cells, then ganglion cells.
- The axons of the ganglion cells come together to form the optic nerve, which carries signals to the brain for interpretation.
The optic disc, where the optic nerve leaves, has no photoreceptors, so it forms a blind spot. A perfectly focused image is useless if the receptors or the nerve pathway cannot pass on its information. OpenStax: vision
Visual disorders
| Disorder | What has changed | Result |
|---|---|---|
| Myopia (short-sightedness) | The eyeball is too long for its focusing power, or the focusing power is too strong. | Light from distant objects focuses in front of the retina when the lens is relaxed. Distant things look blurry. |
| Hyperopia (long-sightedness) | The eyeball is too short for its focusing power, or the focusing power is too weak. | Without enough accommodation, light would focus behind the retina. Near things are often hardest to see. |
| Astigmatism | The cornea or lens is curved unevenly, so it bends light by different amounts in different directions. | Light does not meet at one sharp point on the retina, so vision is blurred or distorted. |
| Presbyopia | With age, the lens becomes less flexible and accommodation weakens. | Near objects become hard to focus on. This is not the same problem as a short eyeball. |
| Cataract | The lens becomes cloudy and blocks light. | Blurred or hazy vision. Adding a focusing lens in front of the eye cannot clear the cloudiness. |
| Retinal or optic-nerve damage | Conditions such as diabetic retinopathy or glaucoma damage the sensory or nerve tissue. | Vision can get worse even when the cornea and lens focus correctly. Correcting focus cannot restore destroyed nerve tissue. |
So inherited factors, development, ageing, injury and disease cause visual disorders in different ways. The cause decides which technology can help. National Eye Institute: refractive errors
How does loss of kidney function affect the body?
loss of kidney function
The kidneys were introduced in the ADH section (see the urinary system figure there). This section looks at how they work, and what happens when they fail.
Blood supply and where urea comes from
Blood reaches each kidney through a renal artery, which branches from the aorta (the body’s main artery). It leaves through a renal vein. Blood does not flow straight from the liver into the renal artery.
When the body breaks down amino acids, it produces ammonia, which is toxic. The liver converts most of it into urea, a less toxic, soluble waste. The blood then carries the urea to the kidneys to be removed.
Inside the kidney
- The outer cortex contains the start of each nephron (the renal corpuscles: glomerulus plus Bowman’s capsule) and the coiled (convoluted) tubules.
- The inner medulla contains the loops of Henle and the collecting ducts.
- Urine drains into the renal pelvis, then down the ureter to the bladder, and leaves through the urethra.
The nephron is the kidney’s working unit: a tiny tube that processes the filtered fluid (the filtrate). Its parts, in order: glomerulus (a knot of capillaries) inside Bowman’s capsule, proximal tubule, loop of Henle, distal tubule, then the collecting duct.
The four processes
| Process | Where and how it happens | Result |
|---|---|---|
| Glomerular filtration | Blood pressure pushes water and small dissolved substances out of the glomerulus into Bowman’s capsule. | Blood cells and most large plasma proteins stay in the blood. The filtrate contains useful substances as well as wastes. |
| Selective reabsorption | Tubule cells move substances back into the blood in the surrounding capillaries, by both active transport (movement that uses energy, often against a concentration gradient) and passive processes. | Normally almost all filtered glucose and amino acids, and much of the water and salt, are recovered. |
| Tubular secretion | Selected substances move from the blood (through the tubule cells) into the filtrate. | Extra wastes and ions are removed; secretion and reabsorption also help control the blood’s pH (acid–base balance). |
| Concentration and excretion | The salty medulla and the adjustable permeability of the collecting duct decide how much water is recovered. What is left leaves as urine. | Water and ion balance are adjusted while wastes are removed. |
How the kidney concentrates urine
- The descending limb of the loop of Henle lets water out.
- The ascending limb reabsorbs salts and is relatively impermeable to water.
- Together these make the medulla very salty, deeper down. This is the medullary osmotic gradient.
- ADH makes the collecting duct more permeable to water, so water moves down its water-potential gradient into the salty tissue and back to the blood.
Water is never actively pumped across the membrane: it always moves by osmosis. NIDDK: how kidneys work

Other kidney jobs
The kidneys also help control blood pressure, make erythropoietin (a hormone that tells the bone marrow to make red blood cells), and activate vitamin D. So kidney failure affects much more than waste removal.
Causes of kidney failure
| Cause | How it damages the kidney |
|---|---|
| Long-term diabetes | Damage to blood vessels and glomeruli can weaken filtration and let too much protein into the urine. Nephrons are gradually lost, so blood composition is less well controlled. |
| High blood pressure (hypertension) | Damages the kidney’s blood vessels, reducing blood flow and causing scarring. Kidney damage can in turn make blood pressure harder to control. |
| Glomerulonephritis | Inflammation damages the glomeruli, which can let blood or protein into the urine and reduce filtration. |
| Polycystic kidney disease | Inherited gene variants can cause fluid-filled cysts that crowd out working kidney tissue. |
| Blockage, poor blood supply or toxic damage | Stones or other blockages stop urine draining. A big drop in blood flow, or toxic damage, can injure nephrons and cause sudden loss of function. |
A cyst is a fluid-filled sac; a kidney stone is a hard lump of crystals that forms from substances in urine. The heart is the muscular pump that drives blood around the body, so it is affected when kidney failure upsets potassium, fluid and blood pressure.
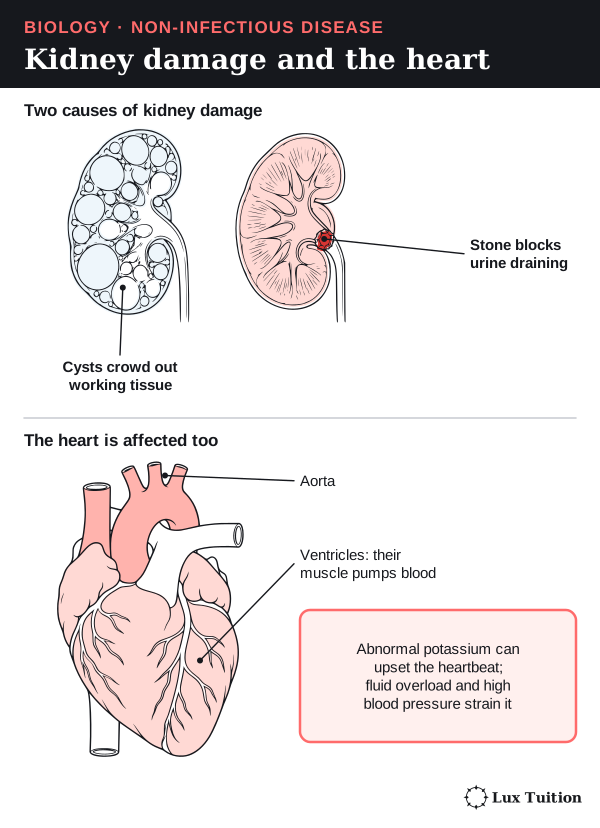
What happens when the kidneys fail
- Wastes such as urea build up in the blood.
- Water and sodium are not controlled, causing fluid overload and high blood pressure.
- Abnormal potassium levels can upset the heart’s electrical rhythm.
- Acid is not removed, so the blood becomes too acidic (acidosis).
- Less erythropoietin is made, contributing to anaemia.
- Poor control of minerals and vitamin D weakens bones.
Because these effects are linked, replacing one process does not replace the whole organ.
How do hearing aids, bone conduction implants and cochlear implants compare?
hearing loss: cochlear implants, bone conduction implants, hearing aids
A hearing technology only helps if the parts of the hearing pathway after the point where it acts still work. The three devices act at different points.
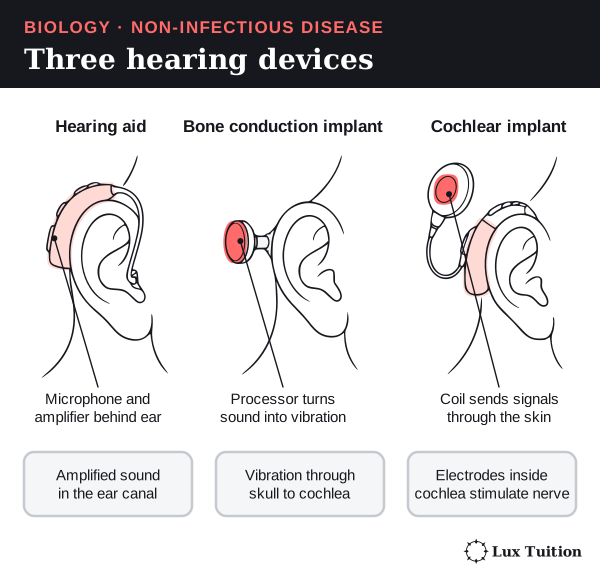
| Technology | How it works | What must still work | Strengths and limitations |
|---|---|---|---|
| Hearing aid | A microphone picks up sound; the device processes and amplifies (makes louder) it; a receiver plays it into the ear canal. | Enough of the ear to conduct sound and turn it into useful nerve signals. | No surgery, and it can be adjusted. It can make speech easier to hear, but it does not regrow hair cells. How well it works depends on how severe the loss is and on background noise. |
| Bone conduction implant | A sound processor turns sound into vibrations that travel through the skull bone straight to a working cochlea. | Enough cochlear and nerve function. | Bypasses (goes around) damaged outer- and middle-ear conduction, so it can help some people with conductive or mixed loss. Needs assessment and, for the implanted part, surgery. It does not replace hair-cell transduction. |
| Cochlear implant | A microphone and processor code the sound; an implanted receiver sends signals to a row of electrodes inside the cochlea, which stimulate the auditory nerve fibres electrically. | A working enough auditory nerve and brain pathway. | Bypasses damaged hair cells and can give useful sound and speech information in suitable severe hearing loss. Needs surgery, programming, and time to learn to interpret the signals. It does not recreate normal hearing or fix every cause of deafness. |
A cochlear implant cannot make up for a missing or non-working auditory nerve by sending a stronger signal. A bone conduction implant still needs a working cochlea, even though it skips the outer and middle ear. NIDCD: hearing aids and cochlear implants
Judging how effective they are
Effectiveness is more than hearing a test tone. Speech understanding, conversation in noisy places, comfort, maintenance, access to rehabilitation and the person’s own preferences all matter.
- If the main problem is lost hair cells and a hearing aid gives little benefit, electrical stimulation (a cochlear implant) may help more.
- If the cochlea works but the conducting pathway is blocked, bypassing that pathway (a bone conduction implant) may suit better.
These are comparisons based on mechanism, not swap-in alternatives or treatment advice for an individual.

How do spectacles and laser surgery correct vision?
visual disorders: spectacles, laser surgery
Start here: two kinds of lens
- A concave (diverging) lens is thinner in the middle than at the edges. It spreads light rays apart.
- A convex (converging) lens is thicker in the middle. It brings light rays together.
Spectacles
- Myopia: a concave lens spreads the light slightly before it enters the eye. This moves the focus back, onto the retina.
- Hyperopia: a convex lens adds focusing power, so the focus moves forward onto the retina.
- Presbyopia: a convex lens of the right strength helps with near vision.
- Astigmatism: a cylindrical (toric) lens corrects the uneven focusing in different directions.
Spectacles change the light reaching the eye. They do not shorten a long eyeball or make an ageing lens flexible again.
- Strengths: no surgery, fully reversible, and easy to update when the prescription changes.
- Limitations: they can break, get in the way during some activities, distort vision at the edges, and only work while you are wearing them.
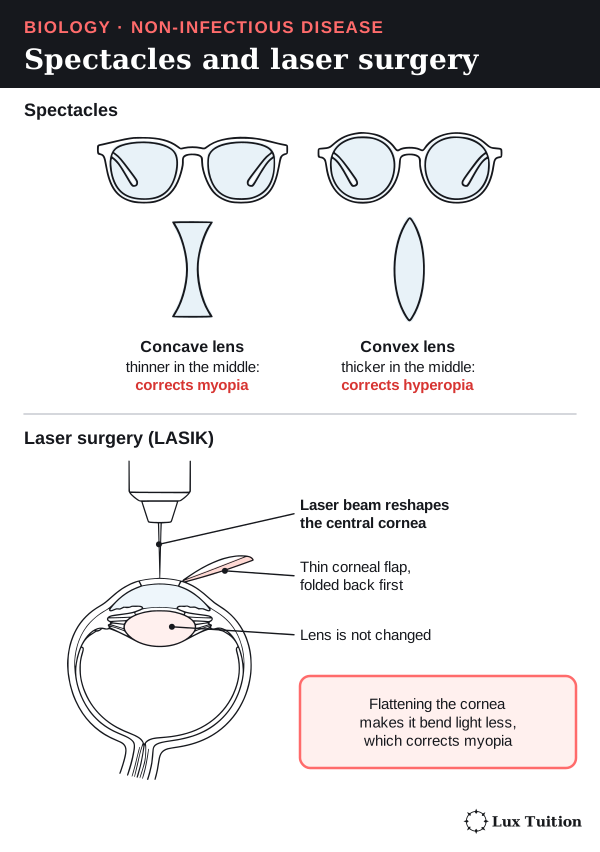
The figure below simplifies the eye to a single lens, which is enough to show where the rays focus.

Laser surgery (LASIK)
Laser refractive surgery, such as LASIK, changes the shape of the cornea, and so changes how strongly it bends light.
- A thin flap is cut in the front of the cornea and folded back.
- A laser removes a precise amount of the tissue underneath (the stroma, the thick middle layer of the cornea), reshaping it.
- The flap is laid back in place.
For myopia, the laser flattens the centre of the cornea, so it bends light less. Other patterns can treat some cases of hyperopia and astigmatism. The target is the cornea, not the retina or the optic nerve.
- Strengths: suitable patients may no longer need glasses for distance vision.
- Limitations: the change is permanent; patients must be screened for suitability; risks include dry eye, glare, halos around lights, and under- or over-correction. It does not stop ageing, does not guarantee a life without glasses, and does not generally restore the lost focusing of presbyopia. A cloudy lens (cataract) needs a different treatment, such as lens replacement: reshaping the cornea cannot clear it. National Eye Institute: refractive surgery

Comparing the two for myopia
For a person with stable myopia who is suitable for surgery, both methods can bring the focus back onto the retina.
- Spectacles give adjustable correction with no surgical risk.
- Surgery can be more convenient day to day, but carries more risk up front and is not right for every eye.
A strong evaluation names the disorder, links each method to how it works, and weighs vision, safety, how long the result lasts, cost and the person’s circumstances.
How effective is dialysis at replacing kidney function?
loss of kidney function: dialysis
evaluate the effectiveness of a technology that is used to manage and assist with the effects of a disorder (ACSBL100)
Dialysis is a treatment that does some of the kidneys’ work when they fail. It removes wastes and excess water from the blood using a selectively permeable membrane: a membrane that lets small particles through but holds back large ones. There are two types.
Haemodialysis: cleaning blood outside the body
- Blood is pumped from the patient’s arm through tubing into a dialyser (the “artificial kidney”).
- Inside the dialyser, blood flows on one side of the membrane and dialysis fluid (dialysate) flows on the other side. The two fluids never mix.
- Small dissolved substances can cross the membrane. Blood cells and most large proteins cannot.
- The cleaned blood returns to the patient.
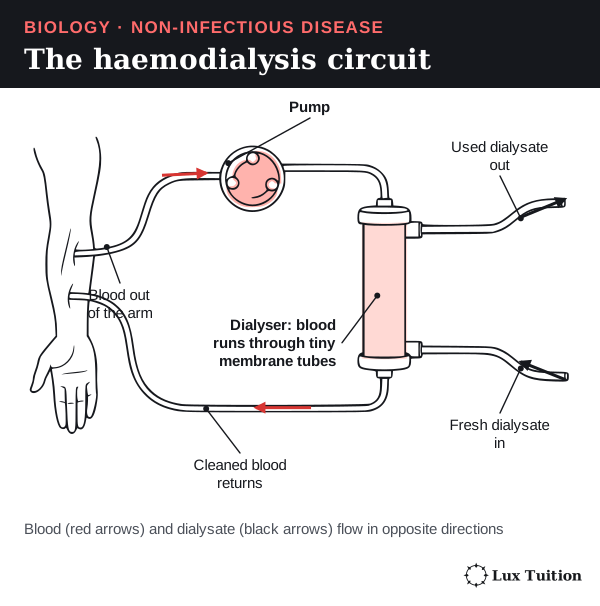
How each substance moves:
- Urea diffuses from the blood, where it is concentrated, into the dialysate, which has almost none.
- Ions: the dialysate’s salt content is set carefully, so excess ions (such as potassium) leave but useful substances are not lost by accident. Bicarbonate can move into the blood to help correct acidosis.
- Excess water is removed mainly by ultrafiltration: a pressure difference across the membrane pushes water out of the blood. This is a different mechanism from the diffusion of urea.
Three features keep exchange efficient:
- Fresh dialysate keeps arriving, and it flows in the opposite direction to the blood (countercurrent flow), so a concentration difference is kept all along the membrane.
- The membrane has a large surface area.
- The diffusion distance is short.
Haemodialysis is not “pumping everything out by osmosis”. Because the blood travels through an outside circuit, patients also need pumps, a blood vessel access point, clot prevention and monitoring. NIDDK: haemodialysis
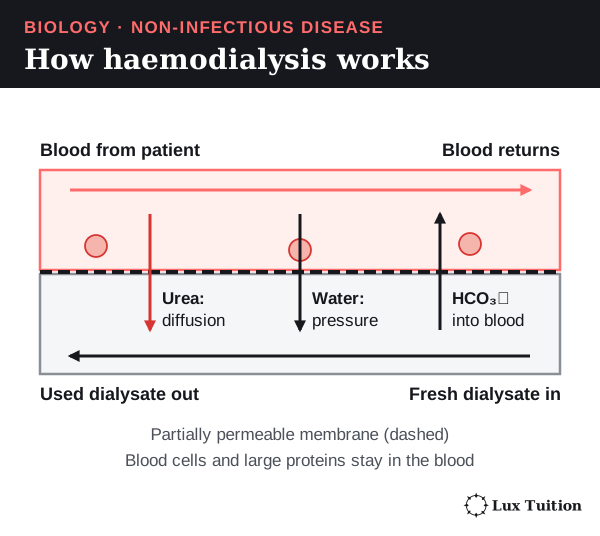
Peritoneal dialysis: using the body’s own membrane
The peritoneum is a thin membrane that lines the inside of the abdomen and covers the organs. The space it encloses is the peritoneal cavity.
- Dialysis solution runs through a soft tube (a catheter) into the peritoneal cavity.
- The peritoneal membrane, with its rich blood supply, is the exchange surface.
- Wastes such as urea diffuse from the blood into the solution.
- Water moves into the solution by osmosis, because the solution contains dissolved substances such as glucose or icodextrin. This is a different water-removal mechanism from the pressure-driven ultrafiltration in haemodialysis.
- After some hours, the used solution is drained out and replaced.
The solution does not normally mix directly with the blood, and the process does not wash the kidneys themselves. NIDDK: peritoneal dialysis
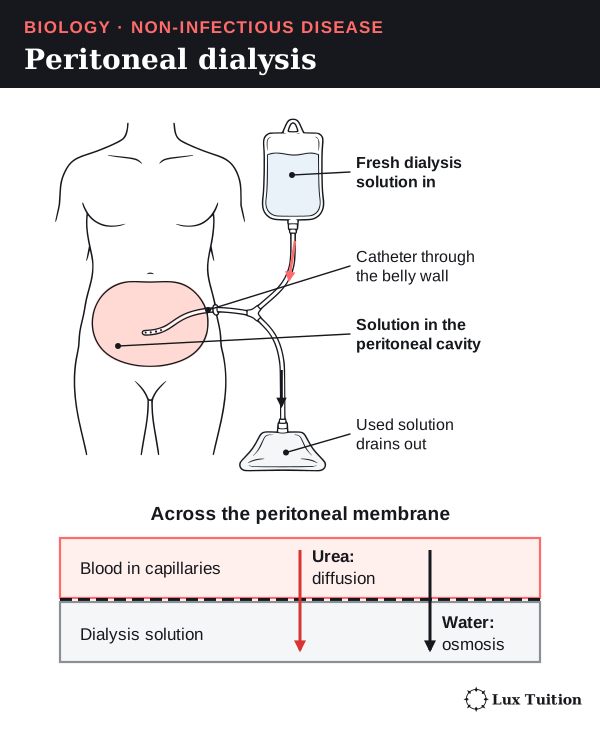
What dialysis can and cannot do
Both types keep people alive by removing wastes and excess fluid and improving salt and acid–base balance. But they do not regrow nephrons, and they do not fully copy the kidney’s continuous control or its hormone production.
- Haemodialysis can mean long treatment sessions, tiredness, problems with the blood vessel access point, and fast changes in body fluid.
- Peritoneal dialysis can be more flexible for some people, but it needs careful technique and carries risks such as peritonitis (infection of the peritoneum).
Which suits a person depends on their medical and practical situation.
Evaluation: how effective is dialysis?
- Highly effective as a life-saving replacement for key excretory functions, when kidney failure would otherwise cause a dangerous internal imbalance.
- Incomplete compared with a healthy kidney: haemodialysis is intermittent (a few sessions a week), and no form of dialysis fully matches the kidney’s continuous, finely adjusted control, even continuous ambulatory peritoneal dialysis, which runs around the clock. Dialysis does not make hormones such as erythropoietin, and it places a heavy burden on daily life.
Useful criteria for judging it: how well it clears wastes, controls fluid and salts, relieves symptoms, avoids complications, and affects survival and quality of life.
A kidney transplant can restore a wider range of functions for suitable people. But donors are scarce, surgery is needed, the body may reject the kidney, and lifelong immunosuppression (drugs that dampen the immune system) is required. Neither option simply restores an undamaged organ with no ongoing care.
Working Scientifically skills for Module 8
HSC questions often test a skill rather than a fact. Each skill below uses a Module 8 example.
Questions and hypotheses
A hypothesis is a testable prediction. A good one states the independent variable, the dependent variable and the expected direction. A “because …” reason is a useful scaffold but not essential: a directional comparison is already a hypothesis.
- Start from an observation or data pattern.
- Ask a question that a measurement could answer.
- Write the hypothesis: “If … then …”, adding “because …” where you can justify a reason.
- Modify it when evidence disagrees, or when a confounder offers another explanation.
Module 8 example: cancer rates differ between two regions. A testable hypothesis: “People who lived near the factory as children will have a higher incidence of the cancer 20 years later than people of the same age who lived elsewhere.” If the difference disappears once smoking is accounted for, the hypothesis is modified to include smoking.
Variables, controls and replication
- The independent variable is what you change; the dependent variable is what you measure; controlled variables are kept the same so the test is fair.
- An experimental control is a comparison group that does not get the treatment, such as the placebo group in the Diabetes Prevention Program.
- Replication means testing several independent samples (different plants or people), not just re-reading one sample.
Module 8 example (potometer): testing how wind affects water uptake. Independent variable: fan speed. Dependent variable: distance the bubble moves per minute. Controlled: the same shoot size and leaf area, light, temperature and humidity. Control: the same set-up with the fan off. Replicates: at least three different shoots.
In experiments, researchers change the independent variable. In observational studies they measure an existing exposure and must address confounders. Harmful exposures cannot ethically be assigned, so such questions use observational designs, but suitable preventive interventions can be randomised (as in the Diabetes Prevention Program) with informed consent.
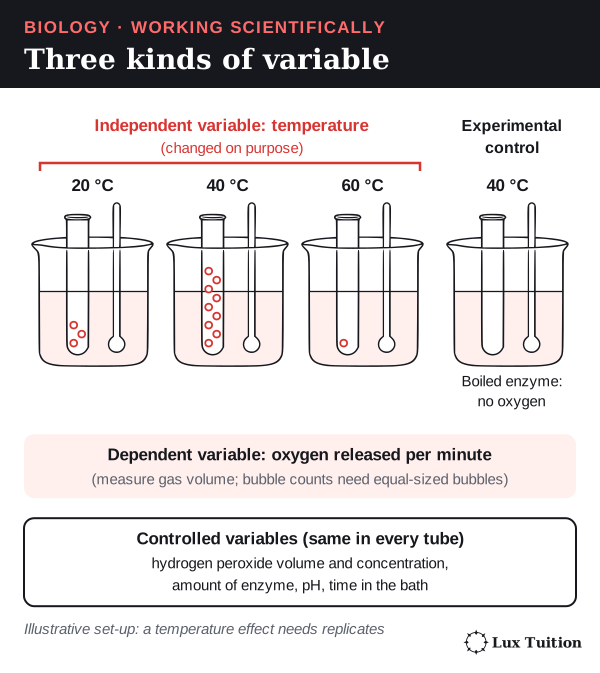
Common mistake: muddling the water. Keep starting water availability consistent, and measure the volume taken up per minute as the dependent variable.
Planning safely and ethically
For each step, name the hazard, the risk and the control. Examples: a sharp blade can cut fingers, so hold the shoot securely on a cutting surface and cut away from your hands. Glass tubing can crack and cut, so inspect it for cracks and avoid forcing it through a bung. Cutting the shoot under water is different: it stops air entering the xylem, which protects the result, not people. Choose equipment that measures what you need: a potometer measures water uptake, which is close to, but not the same as, water loss.
Accuracy, precision, reliability, validity and error
- Accuracy: how close a measurement is to the true value.
- Precision: how close repeated measurements are to each other.
- Reliability: getting consistent results when the investigation is repeated.
- Validity: whether the investigation answers the question it claims to. In a controlled experiment that means only the independent variable changes; an observational study is valid when exposure and outcomes are measured consistently, groups are matched or adjusted for confounders, and follow-up is long enough.
- Random error scatters results either way; averaging independent repeats reduces it. Systematic error shifts results in a consistent way, by a fixed offset or a fixed percentage (such as a balance always 5% high). Averaging cannot remove it: find the cause and correct it, for example by calibrating against a known standard.
- Uncertainty of a reading is often ± half the smallest scale division; the range (highest minus lowest) shows the spread of repeats.
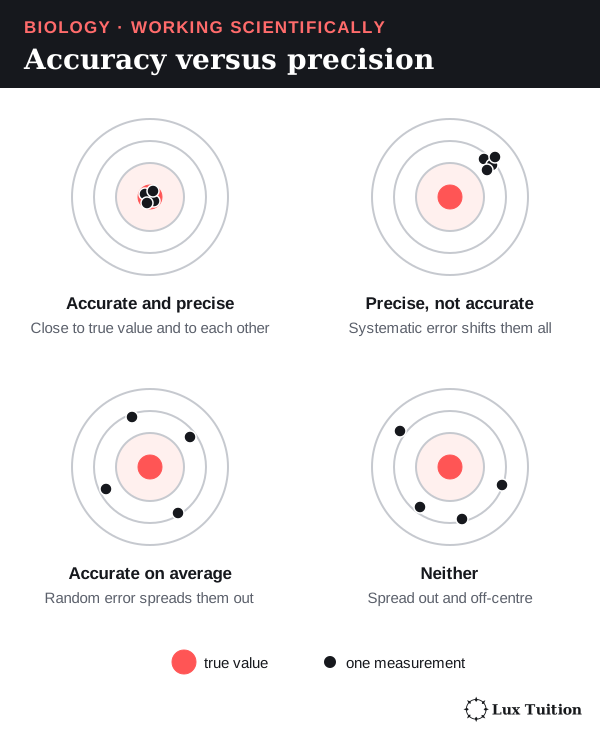
Evaluating and improving an investigation
Name the weakness, say how it affects the result, then give a specific fix.
Module 8 example (a real HSC style): a study compares muscle-pain scores while people take a statin (a cholesterol drug), a placebo and no tablet. Strength: each person is their own control. Weaknesses: pain is self-reported, the sample was selected, and if people knew which tablet they had, expectations could change the scores. Improvements: blind participants and researchers, randomise the order, and use a larger, representative sample.
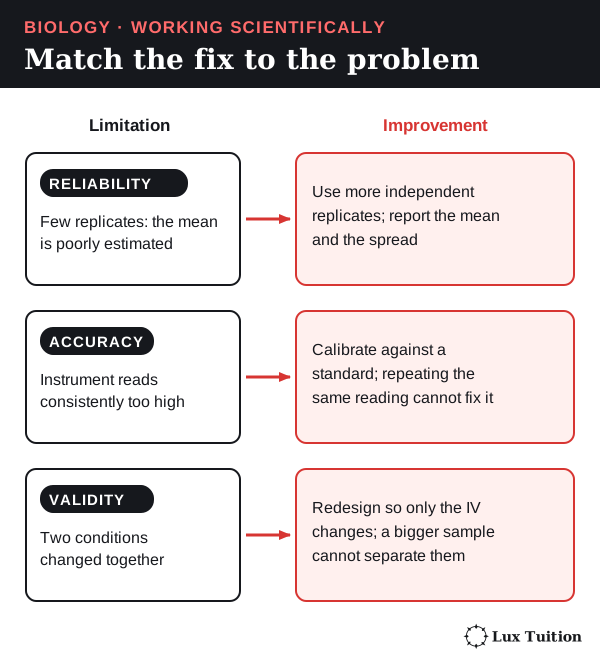
Representing data: choosing and drawing graphs
Categorical data fall into groups (ear, sex, age group); continuous data can take any value (glomerular filtration rate, GFR: the volume of glomerular filtrate formed per minute; or temperature).
- Comparing categories: a column (bar) graph.
- Change over time: a line graph, with year on the horizontal axis and one clearly defined rate on the vertical axis. Show observed values and projections with different line styles, or in separate panels.
- Groups: separate labelled lines for sexes or age groups, on the same scale.
- Two measured continuous variables: a scatter graph with a line of best fit. On its own it cannot prove cause and effect.
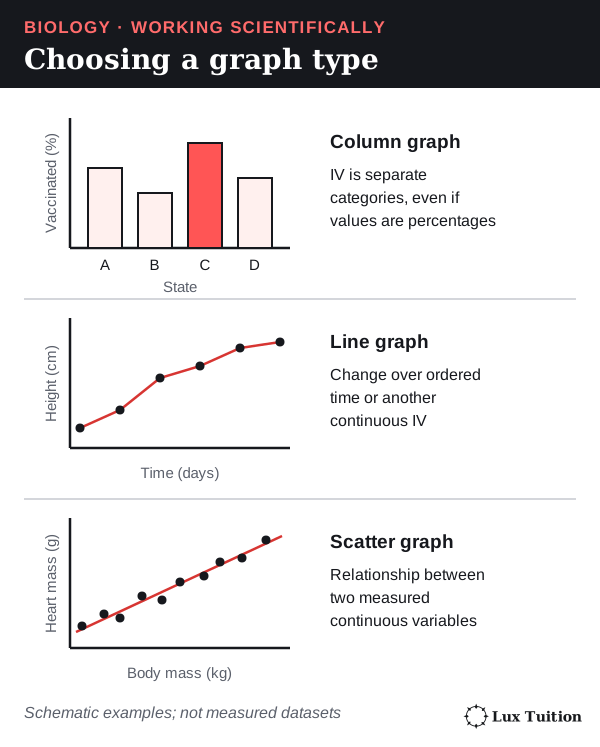
Worked example: plotting and predicting from a graph
- Axes: put the independent variable (such as year) on the horizontal axis. Label each axis with the quantity and its unit, for example “Prevalence (%)”.
- Scale: use an even scale that fills most of the grid.
- Plot each point accurately. For more than one data series, use different symbols and a key. On an audiogram (a hearing-test graph), the hearing threshold gets louder going down the vertical axis, the frequency steps along the horizontal axis often double (250, 500, 1000 Hz…), and O marks the right ear while X marks the left.
- Line of best fit: draw one smooth line or curve that follows the overall trend, with points balanced on both sides. Do not join the dots for a best-fit trend; for a recorded time series, joining successive observations is fine. Follow the question.
- Extrapolate: extend the best-fit line beyond the data. To find when it reaches a threshold, draw a construction line across from the threshold to the line, then down to the year axis, and leave both lines visible. This is an estimate, because it assumes the trend continues.
- Forecast cases: read the predicted percentage, then cases = % ÷ 100 × population. For example, if 7% of 9 billion people were affected: 0.07 × 9,000,000,000 = 630 million (an illustration).
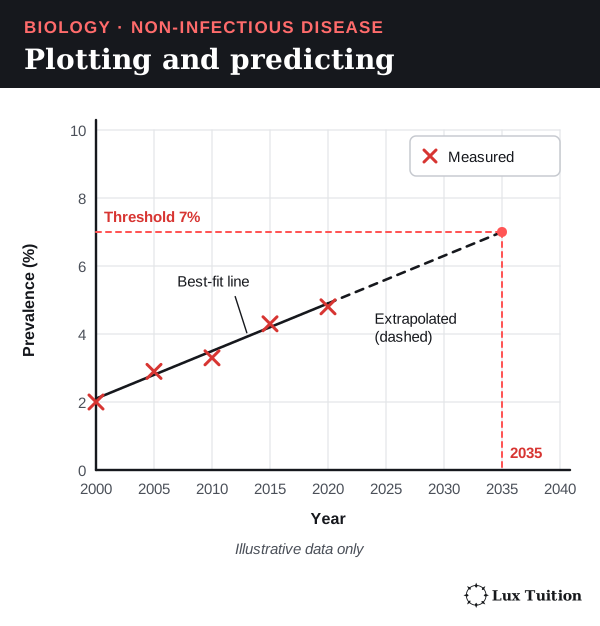
Module 8 uses: an audiogram plots each ear as a separate series; a falling GFR can be extrapolated to the dialysis threshold given in the question to predict the year dialysis is needed; a percentage-by-year graph can be extended to forecast cases.
Common mistakes: an uneven scale, no construction lines when extrapolating, and missing units.
Quantitative methods
- Incidence: for an HSC calculation use the denominator the question supplies and state the period (see the worked example for proportion versus rate).
- Percentage change compares a new value with the old one: (new − old) ÷ old × 100. A change from 4% to 6% is a 50% increase but 2 percentage points.
- Percentage to a count: count = % ÷ 100 × population.
- Mean, median and range: the mean is the average; the median is the middle value (less affected by an extreme value); the range shows spread.
Module 8 example (illustrative): 30 new cases among 12,000 people at risk in a year = 30 ÷ 12,000 × 100,000 = 250 per 100,000 per year.
Models
A model is a simplified representation used to explain or predict. Module 8 uses several: the negative feedback loop, the cube model of surface-area-to-volume ratio, the tank model of prevalence and the one-lens eye in the spectacles ray diagrams. Always state a model’s limit, for example: real animals are not cubes, and the real eye refracts mostly at the cornea.
Secondary sources and corroboration
Judge a source by its author, evidence, date and possible bias. Government health agencies (AIHW, Cancer Australia) and peer-reviewed studies are strong; a product website is weak. Corroboration means separate studies with their own data reaching the same result.
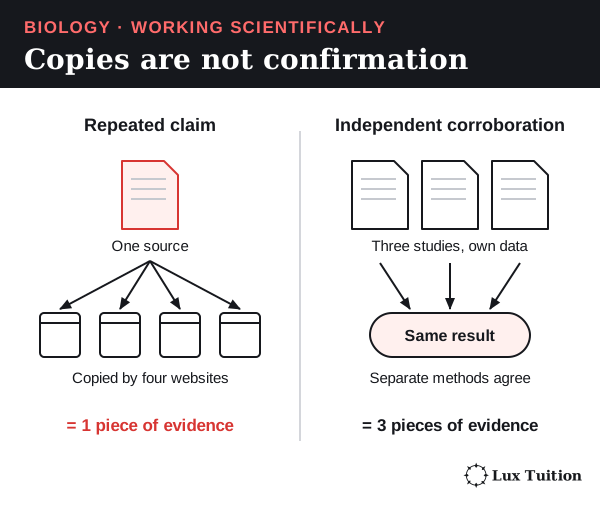
Evidence-based arguments and responding to criticism
Make a claim, back it with specific evidence (numbers, named studies), state the limits, then give a judgement. When a claim is criticised, check whether the criticism points to a real weakness (such as confounding or a mismatched outcome) and change the conclusion if it does.
Module 8 example: claim that dialysis keeps people alive, evidence that it removes urea and excess water, limit that it is incomplete (see the dialysis evaluation). Use correct terms and units.
HSC command words
| Command word | What the answer needs | Module 8 example |
|---|---|---|
| Identify | Name or recognise it | Identify the effector in the cooling loop. |
| Describe | State the features or steps | Describe how ADH changes the collecting duct. |
| Explain | Cause and effect: how and why | Explain why longer survival raises prevalence. |
| Compare | Similarities and differences, side by side | Compare a hearing aid and a cochlear implant. |
| Assess | Make a judgement of value or importance | Assess an education campaign using incidence data. |
| Analyse | Break into parts; show relationships or trends, with evidence | Analyse the trend in incidence and prevalence in a table. |
| Evaluate | Judgement based on strengths and limitations, with evidence | Evaluate the method of a cohort study of air pollution and cancer. |
| Discuss | Considerations and evidence on more than one side, then a conclusion | Discuss the benefits and limits of dialysis. |
| Justify | Support an answer or choice with evidence | Justify the follow-up period chosen for a cohort study. |
These answer shapes are guides, not formulas: what is required depends on the question and the evidence. A justified rejection needs no invented advantage, “compare” needs similarities and differences only when the question says so, and “evaluate” needs a judgement supported by evidence. See the NESA glossary of key words.
Where do these ideas connect across Year 12 Biology?
For pathogens, transmission and infectious disease control, see Module 7: Infectious Disease. The other Year 12 notes are:
Return to the HSC Biology notes overview for course navigation.
Biology tutoring in Blacktown
Our Year 12 Biology classes in Blacktown work through these ideas step by step and give feedback on how students use them in exam answers. Classes have 1–5 students. See current pricing or enquire about a free trial.
Learn it properly with a specialist tutor at Blacktown or online across NSW. Enquire about a free trial — no cost, no obligation. See online formats and class sizes.
Realistic study tips to help you prepare better for assessments with less stress, plus a printable study planner